-
Notifications
You must be signed in to change notification settings - Fork 10.4k
ELK stack
This article contains a brief introduction to setting up the ELK stack in eShopOnContainers. ELK is an acronym of ElasticSearch, LogStash and Kibana. This is one of the most used tools in the industry.
For a more general introduction to structured logging, see the Serilog & Seq page in this wiki.
CONTENT

eShopOnContainers is ready for work with ELK, you only need to setup the configuration parameter LogstashUrl, in Serilog Section, for achieve this, you can do it modifying this parameter in every appsettings.json of every service, or via Environment Variable Serilog:LogstashUrl.
There is another option, a zero-configuration environment for testing the integration launching via docker-compose command, on the root directory of eShopOnContainers:
docker-compose -f docker-compose.yml -f docker-compose.override.yml -f docker-compose.elk.yml build

docker-compose -f docker-compose.yml -f docker-compose.override.yml -f docker-compose.elk.yml upOnce time you have started and configured your application, you only need to configure the logstash index on kibana. You can address to Kibana, with docker-compose setup is at http://localhost:5601
If you have accessed to kibana too early, you can see this error. It's normal, depending of your machine the kibana stack needs a bit of time to startup.

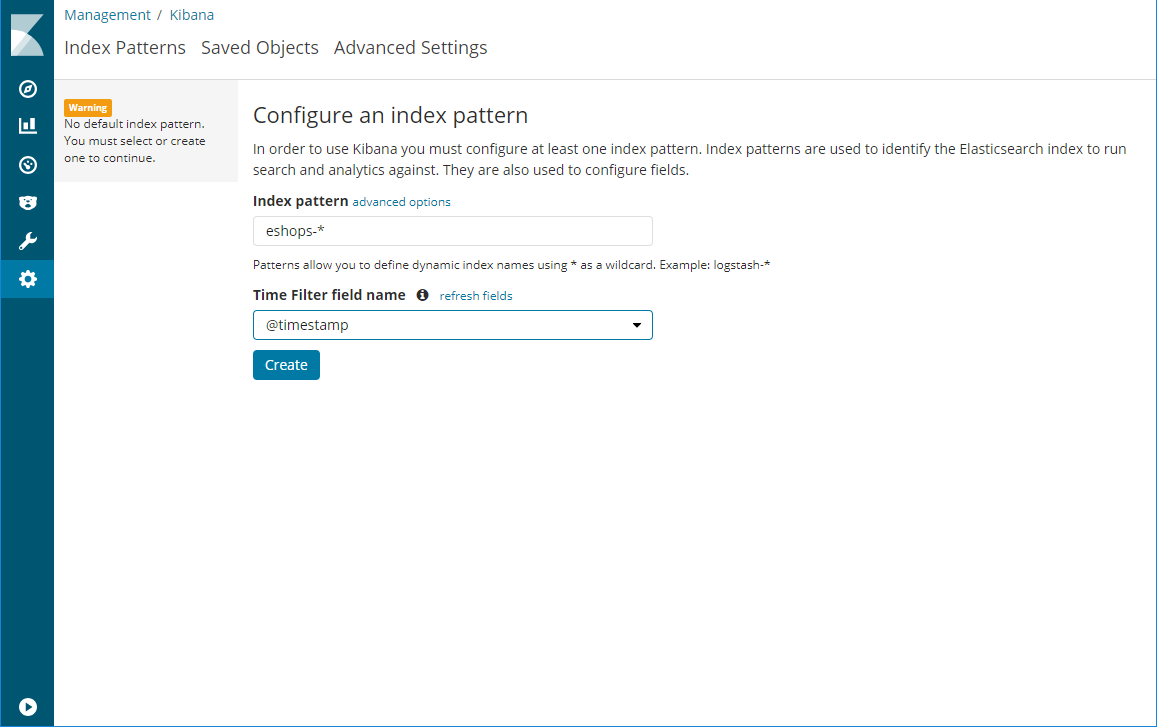
You can wait a bit and refresh the page, the first time you enter, you need to configure and index pattern, in the docker-compose configuration, the index pattern name is eshops-*.

With the index pattern configured, you can enter in the discover section and start viewing how the tool is recollecting the logging information.

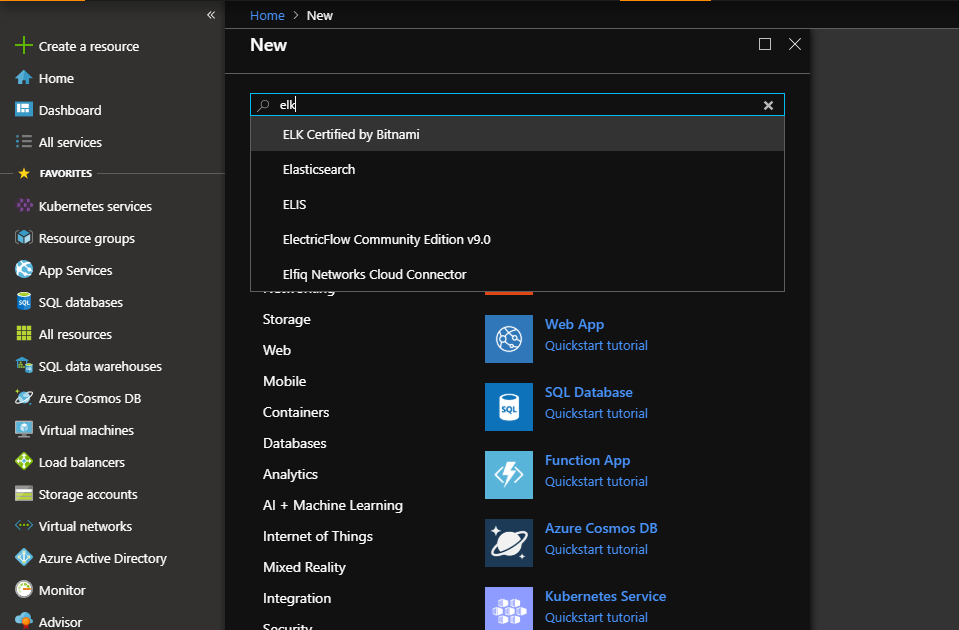
Another option is to use a preconfigured virtual machine with Logstash, ElasticSearch and Kibana and point the configuration parameter LogstashUrl. For doing this you can address to Microsoft Azure, and start searching a Certified ELK Virtual Machine

This options it have a certified preconfigured options (Network, VirtualMachine type, OS, RAM, Disks) for having a good starting point of ELK with good performance.

When you have configured the main aspects of your virtual machine, you will have a "review & create" last step like this:

This virtual machine has a lot of configuration pipeing done. If you want to change something of the default configuration you can address this documentation: https://docs.bitnami.com/virtual-machine/apps/elk/get-started/
The only thing you have to change is the logstash configuration inside the machine. This configuration is at the file /opt/bitnami/logstash/conf/logstash.conf
You must edit the file and overwrite with this configuration:
input {
  http {
    #default host 0.0.0.0:8080
    codec => json
  }
}

## Add your filters / logstash plugins configuration here
filter {
   split {
    field => "events"
    target => "e"
    remove_field => "events"
  }
}

output {
  elasticsearch {
    hosts => "elasticsearch:9200"
    index=>"eshops-%{+xxxx.ww}"
  }
}
For doing this you can connect via ssh to the vm and edit the file using the vi editor for example. When the file will be edited, check there are Inbound Port Rules created for the Logstash service. You can do it going to Networking Menu on your ELK Virtual Machine Resource in Azure.

The only thing that remains is to connect to your vm vía browser. And check the Bitnami splash page is showing.

You can get the password for accessing going to your virtual machine in azure and check the boot diagnostics, there's a message that shows to you which is your password.
When you have the user and password you can access to the Kibana tool, and create the eshops-* index pattern that is well documented at the beginning of this documentation and then start to discover.

- System requirements
- Development setup
- Databases & containers
- Architecture
- Application
- Code
- Logging and Monitoring
- Tests