dsf configure jenkins build monitor view
This tool you will be able to see in real time what is the state of your Jenkins pipelines.
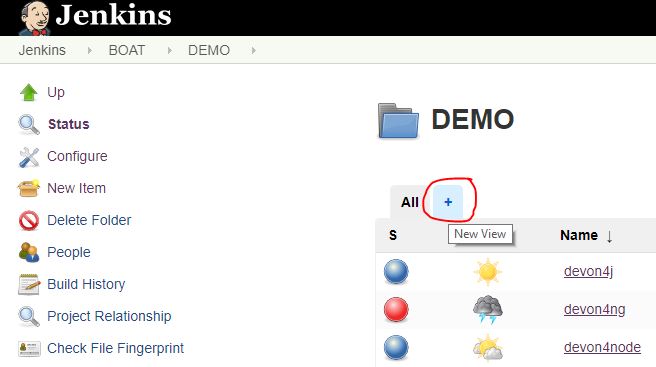
When you have build monitor view installed, you could add a new view clicking on the + tab in the top bar.
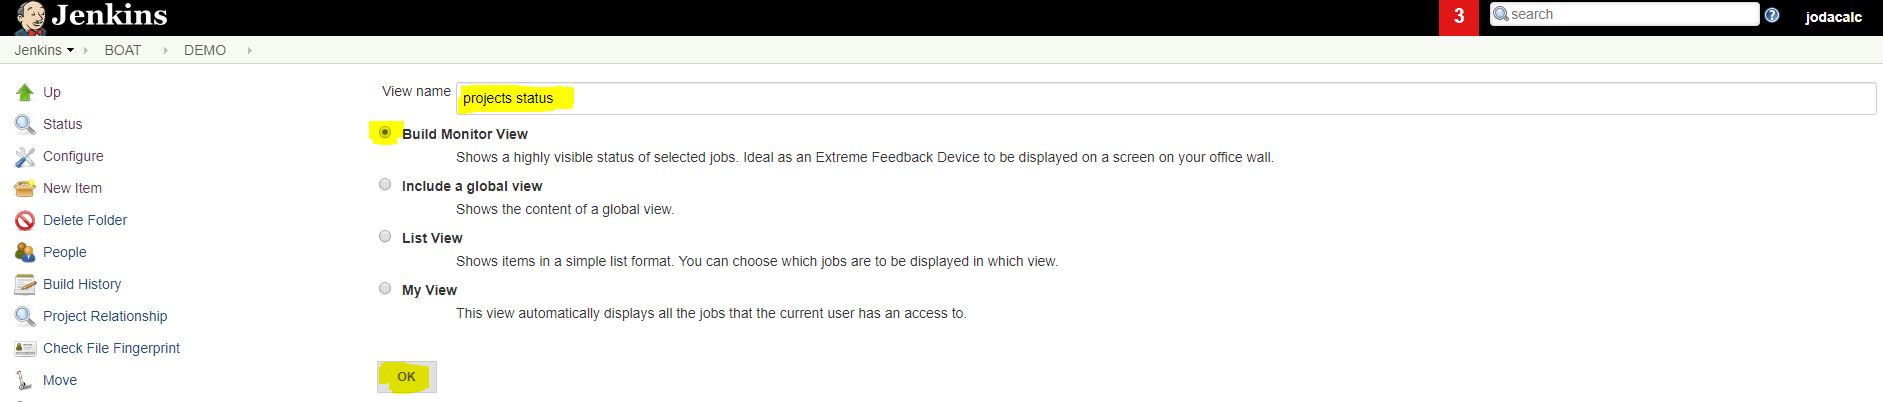
Now you need to fill which is the name that you are goint to give to your view and select Build Monitor View option.
Then you can see the configuration.
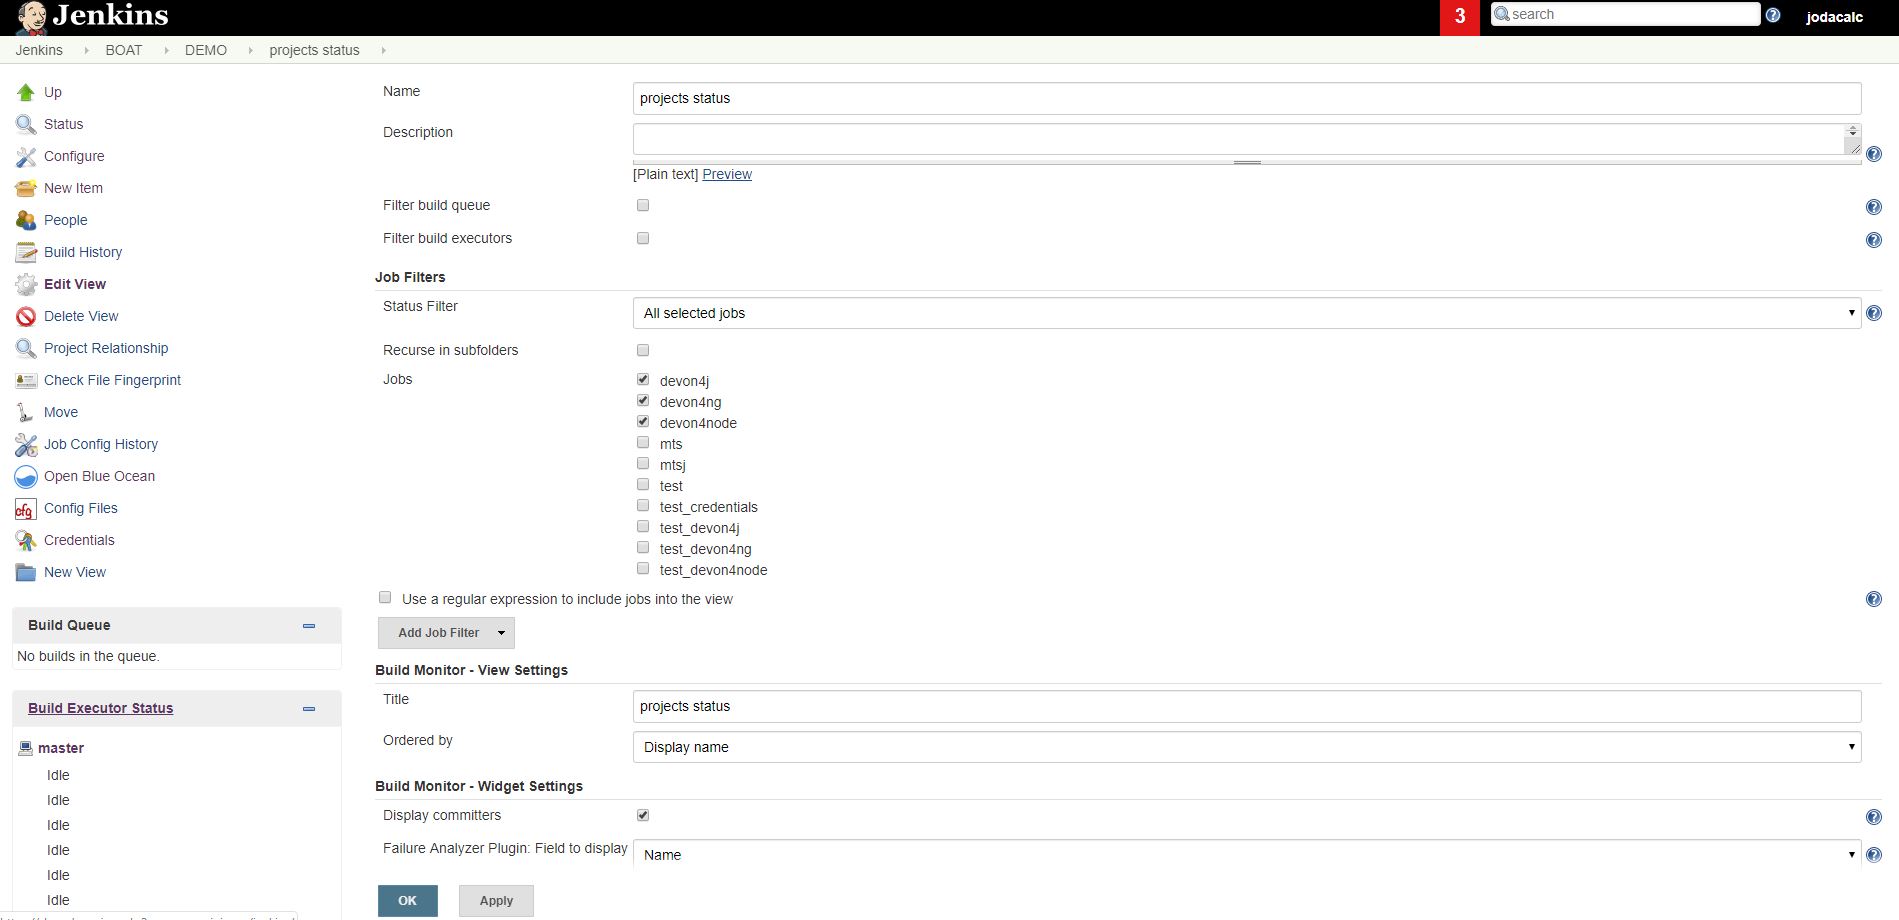
In Job Filters section you can specify which resources are going to be showed and whether subfolders should be included in the search.
In Build Monitor - View Settings you could specify which is the name at the top of the view and what is the ordering criterion.
In Build Monitor - Widget Settings you could specify if you want to show the committers and which is the field to display if it fails.
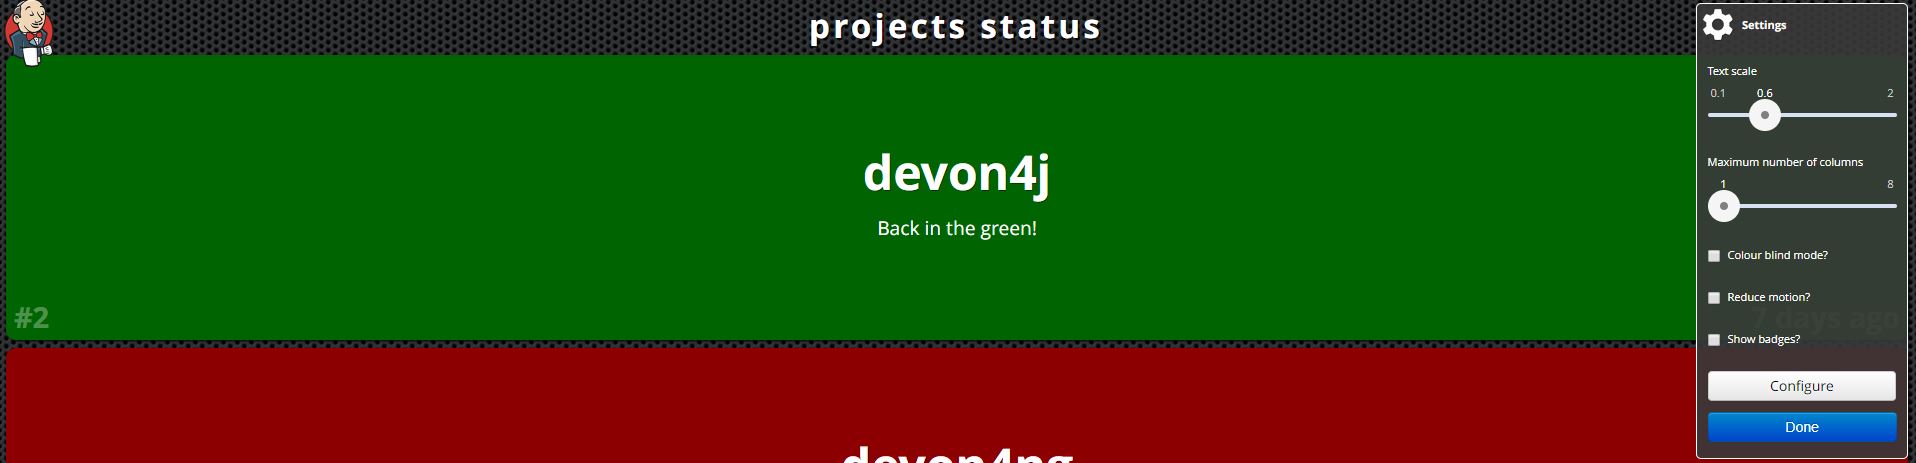
And this is the output:
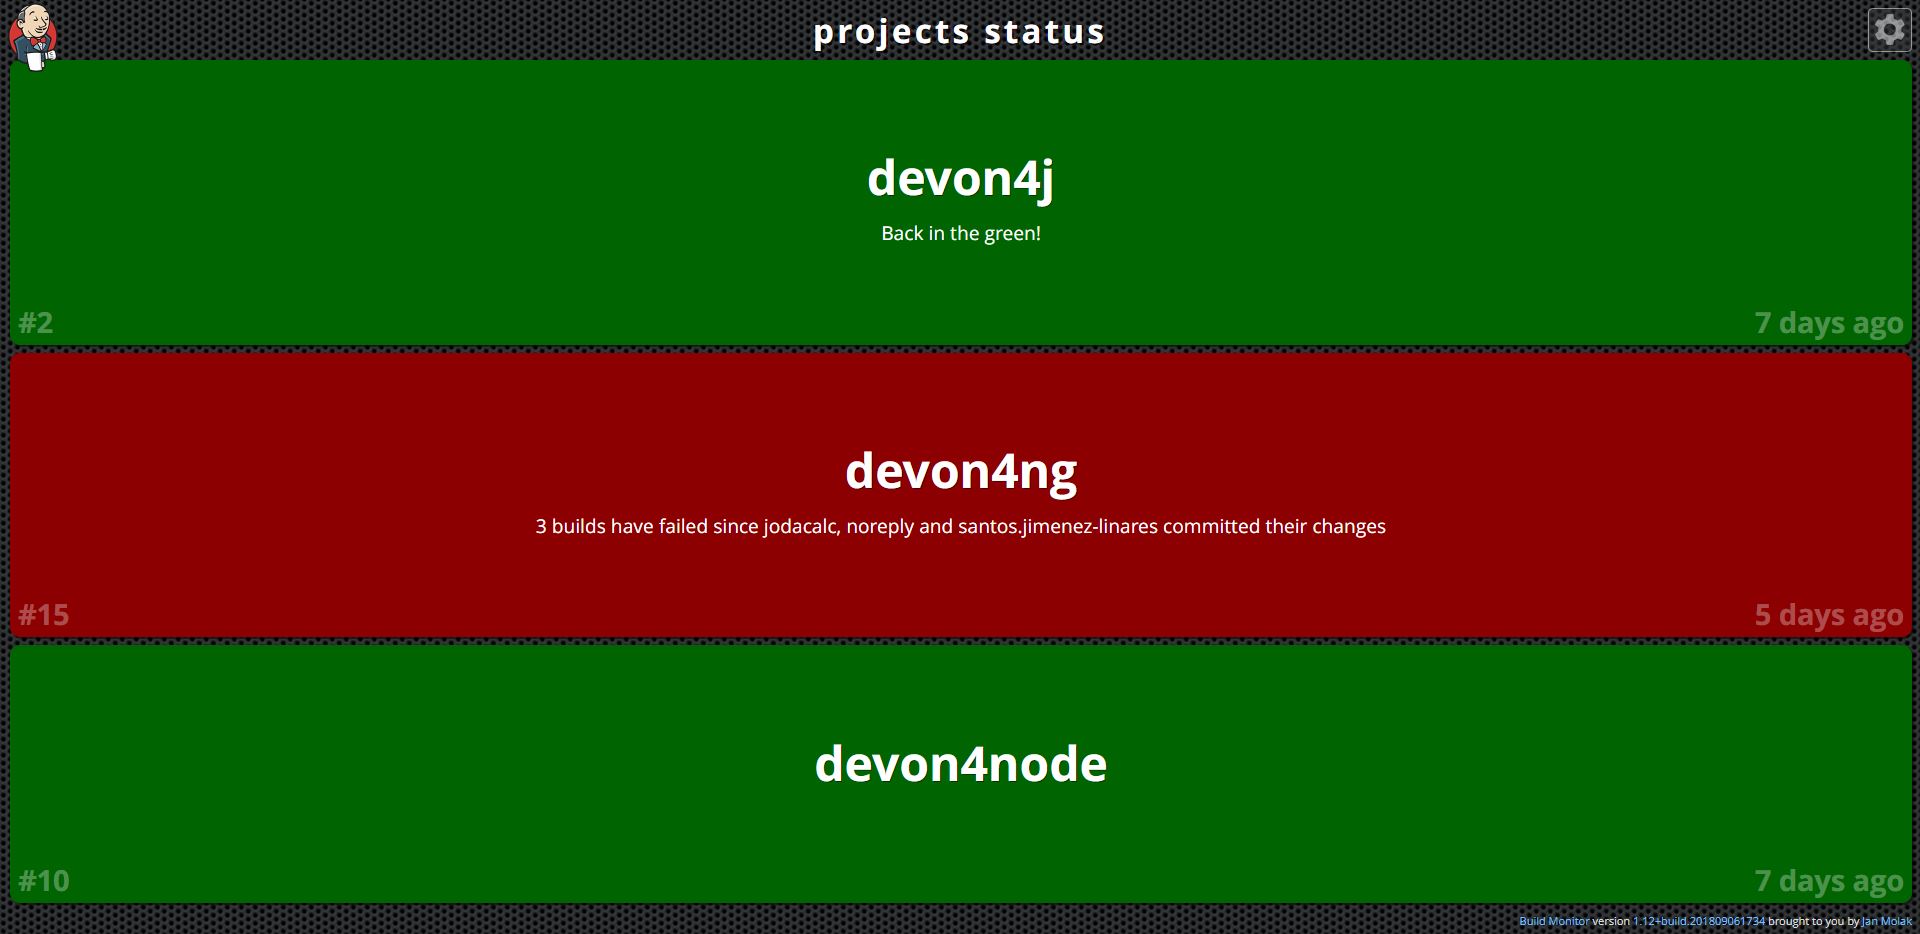
You could limit the colums and the text scale clicking on the gear button at the right top corner.
This documentation is licensed under the Creative Commons License (Attribution-NoDerivatives 4.0 International).
