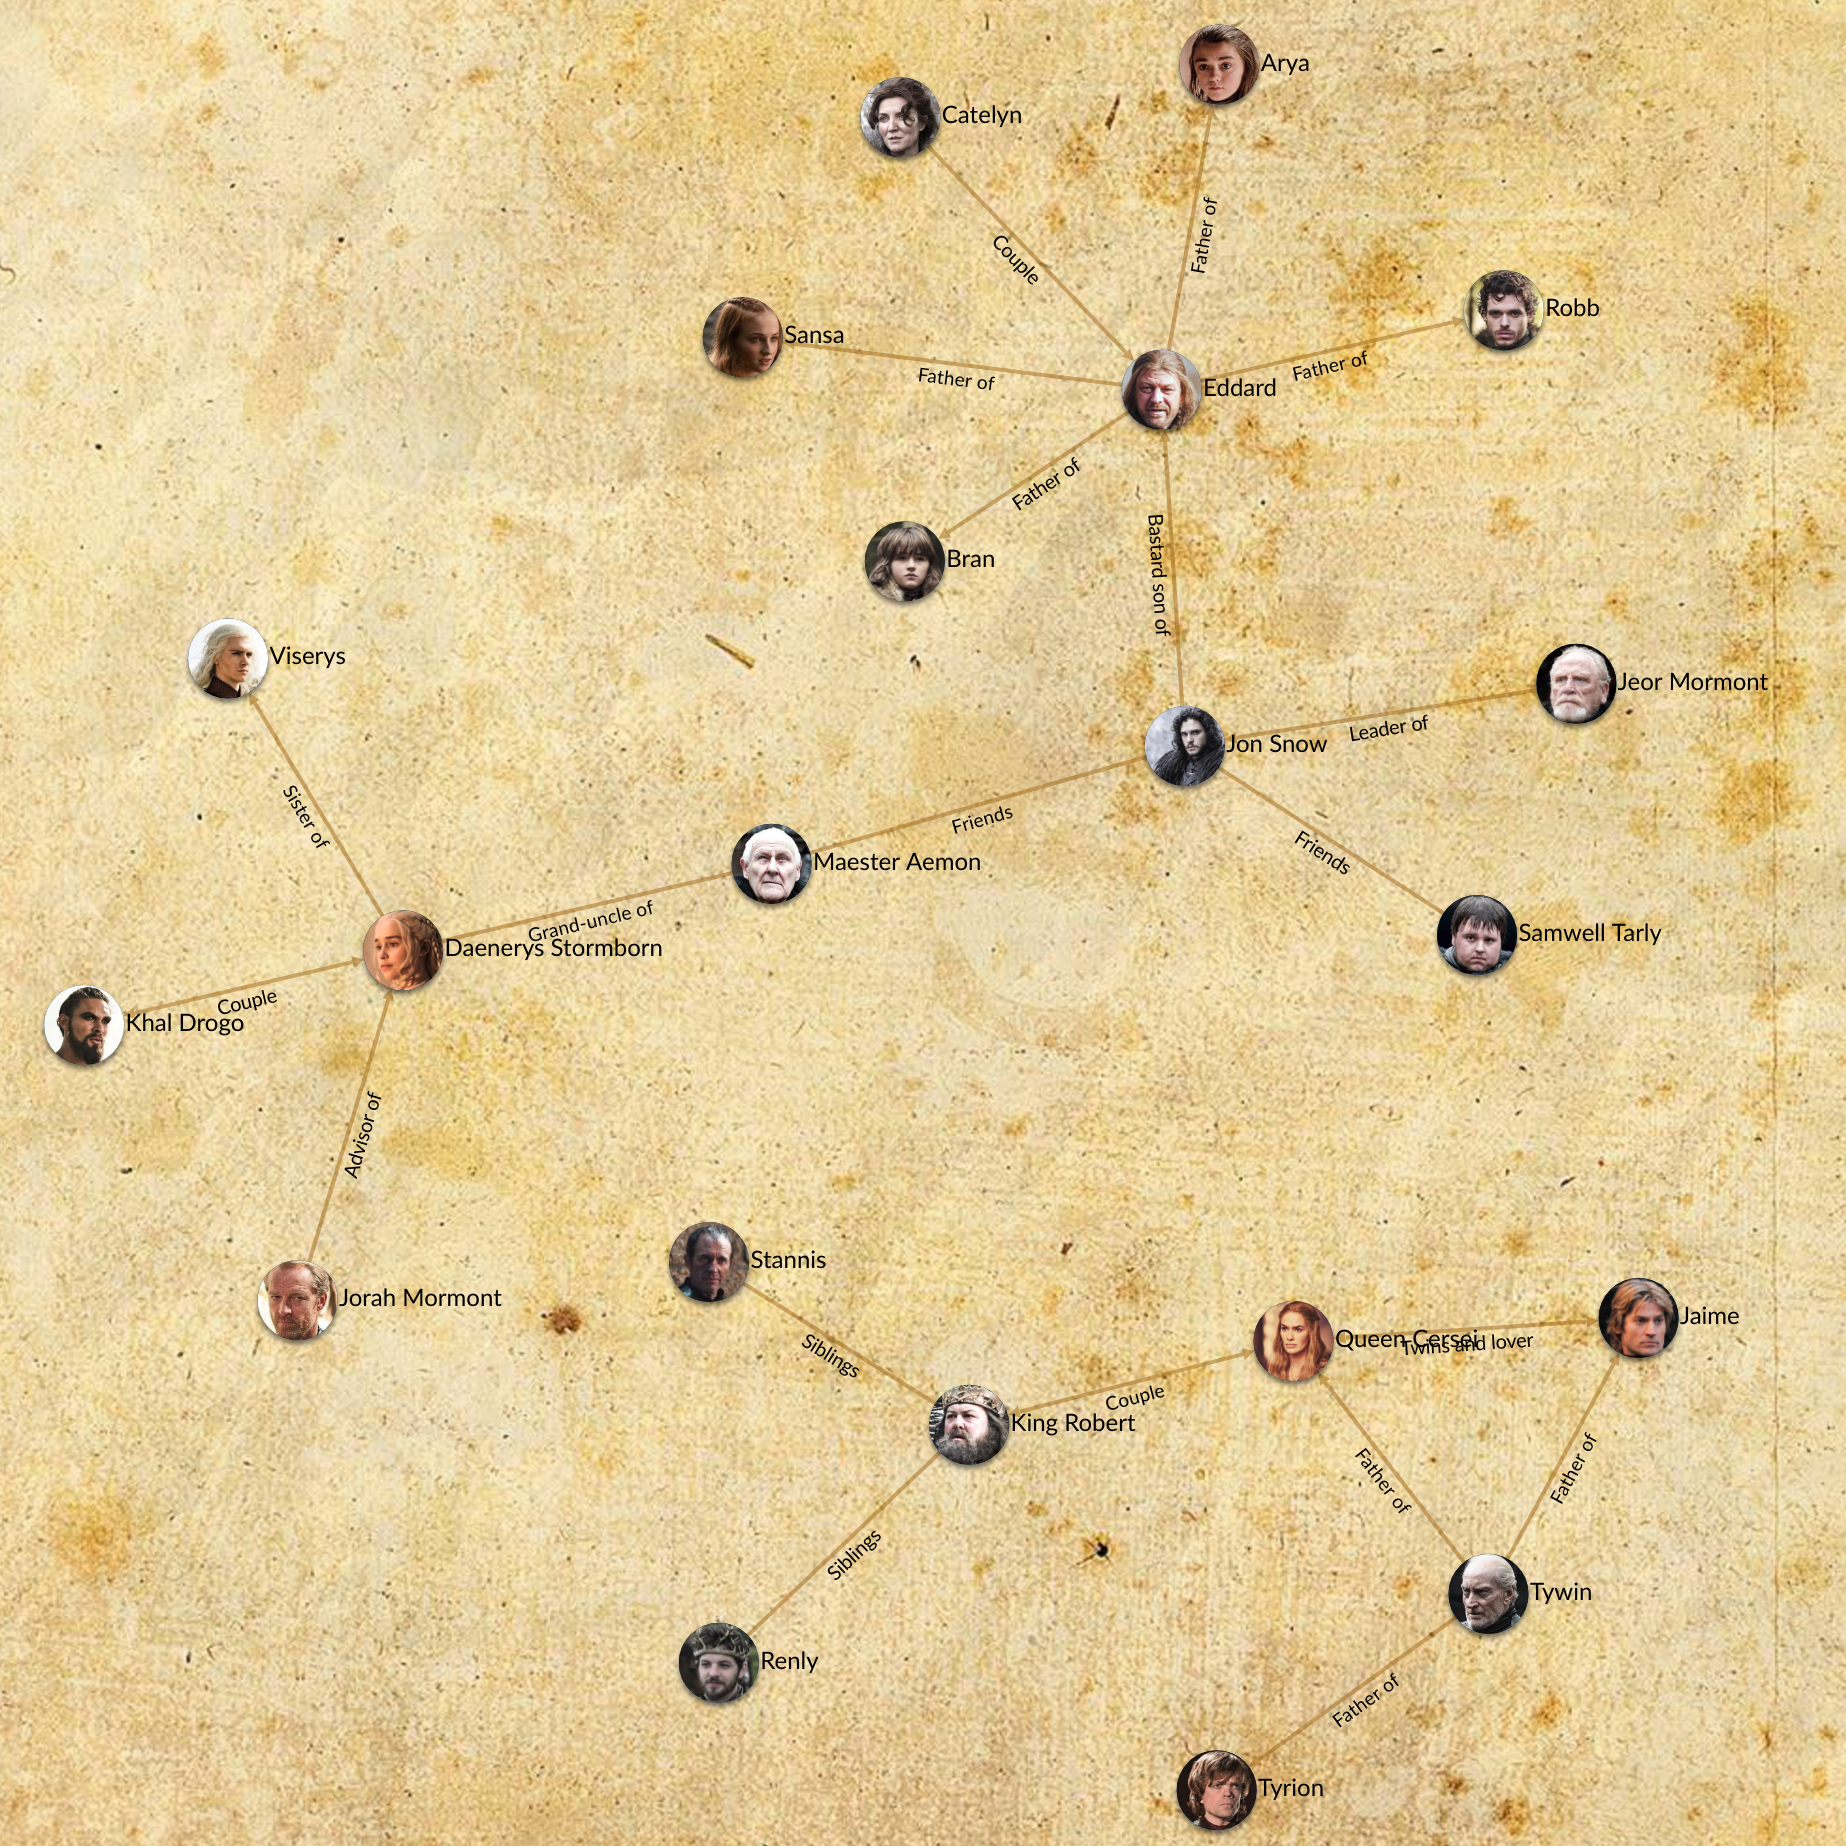
基于D3的图可视化库,可与D3无缝混合使用,通过传入数据和简单的配置,渲染出完整的交互式关联图,同时又提供了很多hook进行自定义。
npm install graph3g3.graph("#my-graph",{
iconPrefix: "fa fa-"
})
.nodes(nodesArr)
.links(linksArr);- id (id is necessary and unique, node with duplicated id can not be added again.)
- label (label of node)
- x (x coordination of node)
- y (y coordination of node)
- color (color of node)
- radius (radius of node)
- icon (icon of node, very easy to use with Font Awesome)
- mugshot (mugshot of node)
- disabled (disabled state of node)
- selected (selected state of node)
- id (id is necessary and unique, link with duplicated id can not be added again.)
- label (label of link)
- src (src point to its source node's id, it eventually generate source property that point to source node)
- dst (dst point to its target node's id, it eventually generate target property that point to target node)
- direction(link arrow's direction)
- value: 0 (no arrow), 1 (point to target), 2 (point to source), 3 (double arrow)
- default: 1
- color (color of link)
- width (line width of link)
- icon (icon of node, very easy to use with Font Awesome)
- mugshot (mugshot of link)
- disabled (disabled state of link)
- selected (selected state of link)
- hide (whether show link)
- radius (node's default radius, default: 15)
- linkWidth (link's default width, default: 3)
- zoomable (whether could zoom and pan graph, default: true)
- dragable (whether could drag nodes, default: true)
- nodeLabelClipWidth (clip label text if longer than this value, default: 500)
- color (node's default color, default: #123456)
- linkColor (link's default color, default: #a1a1a1)
- background (background color or image standard css value, default: #f1f1f1)
- minScale (min scale of zoom, default: 0.1)
- maxScale (max scale of zoom, default: 3.0)
- scaleOfHideNodeLabel (hide node label while zoom scale less than this value, default: 0.8)
- scaleOfHideLinkLabel (hide link label while zoom scale less than this value, default: 0.8)
- icon (default icon of node, default: "")
- iconPrefix (icon class prefix like "fa fa-", default: "")
- mugshot (default mugshot of node, default: "")
- mugshotPrefix (mugshot url prefix link "../img/", default: "")
- bindNodeEvent (bind events to nodes, use d3's api)
- bindLinkEvent (bind events to links, use d3's api)
- bindGraphEvent (bind events to svg element, use d3's api)
##Hook
If you want to add your code to node's generation process, you can use hooks below.
- insertNode (add custom code to insert process)
- updateNode (add custom code to update process)
##Method .nodes(nodeArr) if a node array is specified, add nodes to graph, else return all nodes.
.links(linkArr) if a link array is specified, add links to graph, else return all links.
