This project is stable and being incubated for long-term support. It may contain new experimental code, for which APIs are subject to change.
Causal ML is a Python package that provides a suite of uplift modeling and causal inference methods using machine learning algorithms based on recent
research. It provides a standard interface that allows user to estimate the Conditional Average Treatment Effect (CATE) or Individual Treatment
Effect (ITE) from experimental or observational data. Essentially, it estimates the causal impact of intervention T on outcome Y for users
with observed features X, without strong assumptions on the model form. Typical use cases include
-
Campaign targeting optimization: An important lever to increase ROI in an advertising campaign is to target the ad to the set of customers who will have a favorable response in a given KPI such as engagement or sales. CATE identifies these customers by estimating the effect of the KPI from ad exposure at the individual level from A/B experiment or historical observational data.
-
Personalized engagement: A company has multiple options to interact with its customers such as different product choices in up-sell or messaging channels for communications. One can use CATE to estimate the heterogeneous treatment effect for each customer and treatment option combination for an optimal personalized recommendation system.
The package currently supports the following methods
- Tree-based algorithms
- Uplift tree/random forests on KL divergence, Euclidean Distance, and Chi-Square
- Uplift tree/random forests on Contextual Treatment Selection
- Meta-learner algorithms
- S-learner
- T-learner
- X-learner
- R-learner
Install dependencies:
$ pip install -r requirements.txt
Install from pip:
$ pip install causalml
Install from source:
$ git clone https://github.com/uber/causalml.git
$ cd causalml
$ python setup.py build_ext --inplace
$ python setup.py install
from causalml.inference.meta import LRSRegressor
from causalml.inference.meta import XGBTRegressor, MLPTRegressor
from causalml.inference.meta import BaseXRegressor
from causalml.inference.meta import BaseRRegressor
from xgboost import XGBRegressor
from causalml.dataset import synthetic_data

y, X, treatment, _, _, e = synthetic_data(mode=1, n=1000, p=5, sigma=1.0)

lr = LRSRegressor()
te, lb, ub = lr.estimate_ate(X, treatment, y)
print('Average Treatment Effect (Linear Regression): {:.2f} ({:.2f}, {:.2f})'.format(te[0], lb[0], ub[0]))

xg = XGBTRegressor(random_state=42)
te, lb, ub = xg.estimate_ate(X, treatment, y)
print('Average Treatment Effect (XGBoost): {:.2f} ({:.2f}, {:.2f})'.format(te[0], lb[0], ub[0]))

nn = MLPTRegressor(hidden_layer_sizes=(10, 10),
                 learning_rate_init=.1,
                 early_stopping=True,
                 random_state=42)
te, lb, ub = nn.estimate_ate(X, treatment, y)
print('Average Treatment Effect (Neural Network (MLP)): {:.2f} ({:.2f}, {:.2f})'.format(te[0], lb[0], ub[0]))

xl = BaseXRegressor(learner=XGBRegressor(random_state=42))
te, lb, ub = xl.estimate_ate(X, e, treatment, y)
print('Average Treatment Effect (BaseXRegressor using XGBoost): {:.2f} ({:.2f}, {:.2f})'.format(te[0], lb[0], ub[0]))

rl = BaseRRegressor(learner=XGBRegressor(random_state=42))
te, lb, ub =  rl.estimate_ate(X=X, p=e, treatment=treatment, y=y)
print('Average Treatment Effect (BaseRRegressor using XGBoost): {:.2f} ({:.2f}, {:.2f})'.format(te[0], lb[0], ub[0]))
See the Meta-learner example notebook for details.
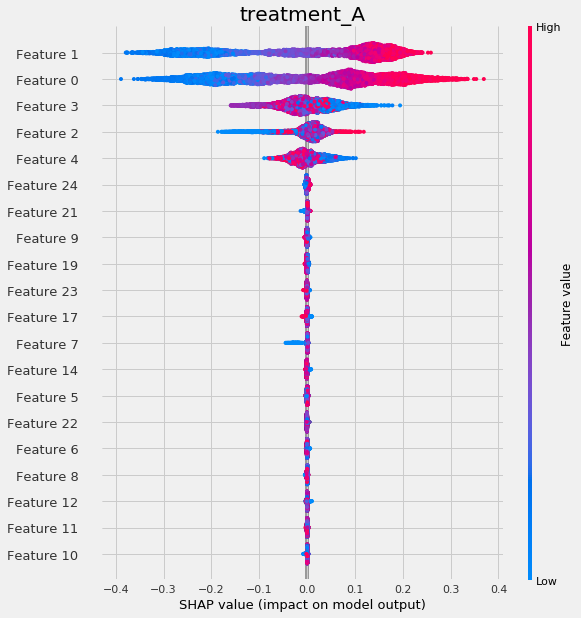
Causal ML provides methods to interpret the treatment effect models trained as follows:
from causalml.inference.meta import BaseSRegressor, BaseTRegressor, BaseXRegressor, BaseRRegressor

slearner = BaseSRegressor(LGBMRegressor(), control_name='control')
slearner.estimate_ate(X, w_multi, y)
slearner_tau = slearner.fit_predict(X, w_multi, y)

model_tau_feature = RandomForestRegressor()  # specify model for model_tau_feature

slearner.get_importance(X=X, tau=slearner_tau, model_tau_feature=model_tau_feature,
                        normalize=True, method='auto', features=feature_names)

# Using the feature_importances_ method in the base learner (LGBMRegressor() in this example)
slearner.plot_importance(X=X, tau=slearner_tau, normalize=True, method='auto')

# Using eli5's PermutationImportance
slearner.plot_importance(X=X, tau=slearner_tau, normalize=True, method='permutation')

# Using SHAP
shap_slearner = slearner.get_shap_values(X=X, tau=slearner_tau)

# Plot shap values without specifying shap_dict
slearner.plot_shap_values(X=X, tau=slearner_tau)

# Plot shap values WITH specifying shap_dict
slearner.plot_shap_values(shap_dict=shap_slearner)

# interaction_idx set to 'auto' (searches for feature with greatest approximate interaction)
slearner.plot_shap_dependence(treatment_group='treatment_A',
                              feature_idx=1,
                              X=X,
                              tau=slearner_tau,
                              interaction_idx='auto')
See the feature interpretations example notebook for details.
from IPython.display import Image
from causalml.inference.tree import UpliftTreeClassifier, UpliftRandomForestClassifier
from causalml.inference.tree import uplift_tree_string, uplift_tree_plot

uplift_model = UpliftTreeClassifier(max_depth=5, min_samples_leaf=200, min_samples_treatment=50,
                                    n_reg=100, evaluationFunction='KL', control_name='control')

uplift_model.fit(df[features].values,
                 treatment=df['treatment_group_key'].values,
                 y=df['conversion'].values)

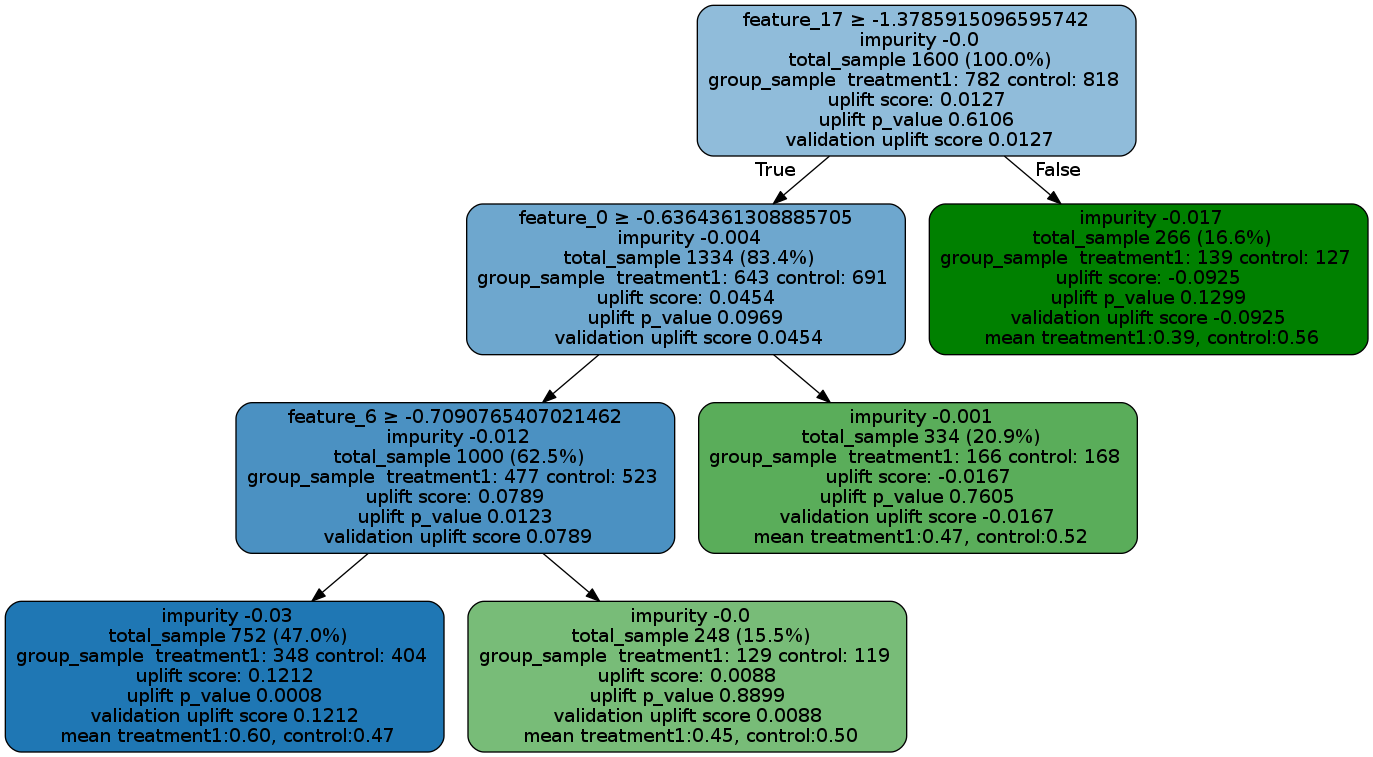
graph = uplift_tree_plot(uplift_model.fitted_uplift_tree, features)
Image(graph.create_png())
See the Uplift Tree visualization example notebook for details.
We welcome community contributors to the project. Before you start, please read our code of conduct and check out contributing guidelines first.
We document versions and changes in our changelog.
This project is licensed under the Apache 2.0 License - see the LICENSE file for details.
- Nicholas J Radcliffe and Patrick D Surry. Real-world uplift modelling with significance based uplift trees. White Paper TR-2011-1, Stochastic Solutions, 2011.
- Yan Zhao, Xiao Fang, and David Simchi-Levi. Uplift modeling with multiple treatments and general response types. Proceedings of the 2017 SIAM International Conference on Data Mining, SIAM, 2017.
- Sören R. Künzel, Jasjeet S. Sekhon, Peter J. Bickel, and Bin Yu. Metalearners for estimating heterogeneous treatment effects using machine learning. Proceedings of the National Academy of Sciences, 2019.
- Xinkun Nie and Stefan Wager. Quasi-Oracle Estimation of Heterogeneous Treatment Effects. Atlantic Causal Inference Conference, 2018.
- uplift: uplift models in R
- grf: generalized random forests that include heterogeneous treatment effect estimation in R
- rlearner: A R package that implements R-Learner
- DoWhy: Causal inference in Python based on Judea Pearl's do-calculus
- EconML: A Python package that implements heterogeneous treatment effect estimators from econometrics and machine learning methods


