Integrate your MATLAB® Job Scheduler cluster with Grafana® and Prometheus® to provide live cluster monitoring and alerts.
To use this cluster monitoring integration, you must have a MATLAB Job Scheduler for MATLAB Parallel Server™ R2024b or later that is configured to export metrics.
To learn how to configure MATLAB Job Scheduler to export metrics, see the MathWorks® documentation for Configure Metrics for MATLAB Job Scheduler.
Tip
To check if a job manager exports metrics, call the nodestatus command on the host running the job manager. If the job manager's details include a Metrics URL entry, it exports metrics at that URL. You can view the raw metrics by navigating to the Metrics URL in a web browser. If the URL begins with https, the job manager exports encrypted metrics and you might need to import security certificates and keys into the browser to view the page.
To download a ZIP archive of this repository, select Code > Download ZIP at the top of this page. Alternatively, to clone this repository to your computer with Git software installed, enter this command at your system command line:
git clone https://github.com/mathworks/cluster-monitoring-integration-for-matlab-job-scheduler
Download and install the latest version of Prometheus. For help with installing Prometheus, see Installation on the Prometheus website.
Create a YAML file prometheus.yml containing the Prometheus configuration parameters and values for the MATLAB Job Scheduler. You can use the following minimal example and modify the values for your cluster configuration:
rule_files:
  - '<alerts.yml>'

scrape_configs:
  - job_name: 'mjs'
    static_configs:
      - targets: ['<job-manager-hostname>:<metrics-port>']
    scrape_interval: 5s

    # The following block is required only if you have configured MATLAB Job Scheduler to export encrypted metrics
    scheme: https
    tls_config:
      ca_file: '<ca.crt>' # The CA certificate used to verify the job manager's public certificate
      cert_file: '<prometheus.crt>' # The public certificate presented to the job manager for verification
      key_file: '<prometheus.key>' # The private key associated with cert_file
Replace:
<alerts.yml>with the full path to the alerts.yml file provided in this repository<job-manager-hostname>with the hostname of the job manager<metrics-port>with theMETRICS_PORTparameter (default8001) configured in themjs_deffile
If you have configured MATLAB Job Scheduler to export encrypted metrics (USE_SECURE_METRICS is set to true in the mjs_def file), you must include the additional configuration block shown in the example above and replace:
<ca.crt>with the full path to the CA certificate that is used to verify the job manager's public certificate. The job manager's public certificate is specified in theMETRICS_CERT_FILEparameter of themjs_deffile<prometheus.crt>with the full path to the public certificate presented to the job manager for verification. The job manager uses its CA certificate, which is specified in theMETRICS_CA_FILEparameter of themjs_deffile, to perform this verification<prometheus.key>with the full path to the private key associated with<prometheus.crt>
Important
If you have configured MATLAB Job Scheduler to export encrypted metrics, <job-manager-hostname> must exactly match the hostname in the job manager's certificate. If you use the mjssetup tool to generate the certificate and key files, the hostname is the value you pass to the -jobmanagerhost argument.
Alternatively, you can disable verification of the job manager's public certificate by specifying insecure_skip_verify: true in the tls_config block. For security best practices, do not disable verification of the job manager's public certificate.
You can specify additional configuration options for the Prometheus server to meet your requirements. For information about the configuration options, see Configuration on the Prometheus website. For information on how to encrypt Grafana's connection to the Prometheus server, see Securing Prometheus API and UI endpoints using TLS encryption on the Prometheus website.
Start Prometheus with the configuration file above. For example, to start Prometheus with a configuration file named prometheus.yml, run:
prometheus --config.file=prometheus.yml
Tip
To check that Prometheus is set up successfully, open a web browser to port 9090 on the Prometheus host using a URL of the form http://<prometheus-host>:9090 and verify the expression mjs_up has a non-empty result. If you cannot connect to a Prometheus web page, it is likely that Prometheus has failed to start successfully. If mjs_up returns an empty result, it is likely that Prometheus cannot connect to the job manager. In either case, to learn more about the cause of the problem, enable detailed logging when you start Prometheus:
prometheus --config.file=prometheus.yml --log.level=debug
Download, install, and start the latest version of Grafana. For more details, see Set up Grafana on the Grafana website. To sign in to Grafana, open a web browser to port 3000 on the local host using the URL http://localhost:3000. The default username and password for Grafana is admin.
From Grafana, add a new Prometheus data source. The default URL for the Prometheus server is http://localhost:9090. For more details, see Configure Prometheus on the Grafana website.
Import the dashboard.json file provided in this repository into Grafana. For more details, see Import dashboards on the Grafana website.
Tip
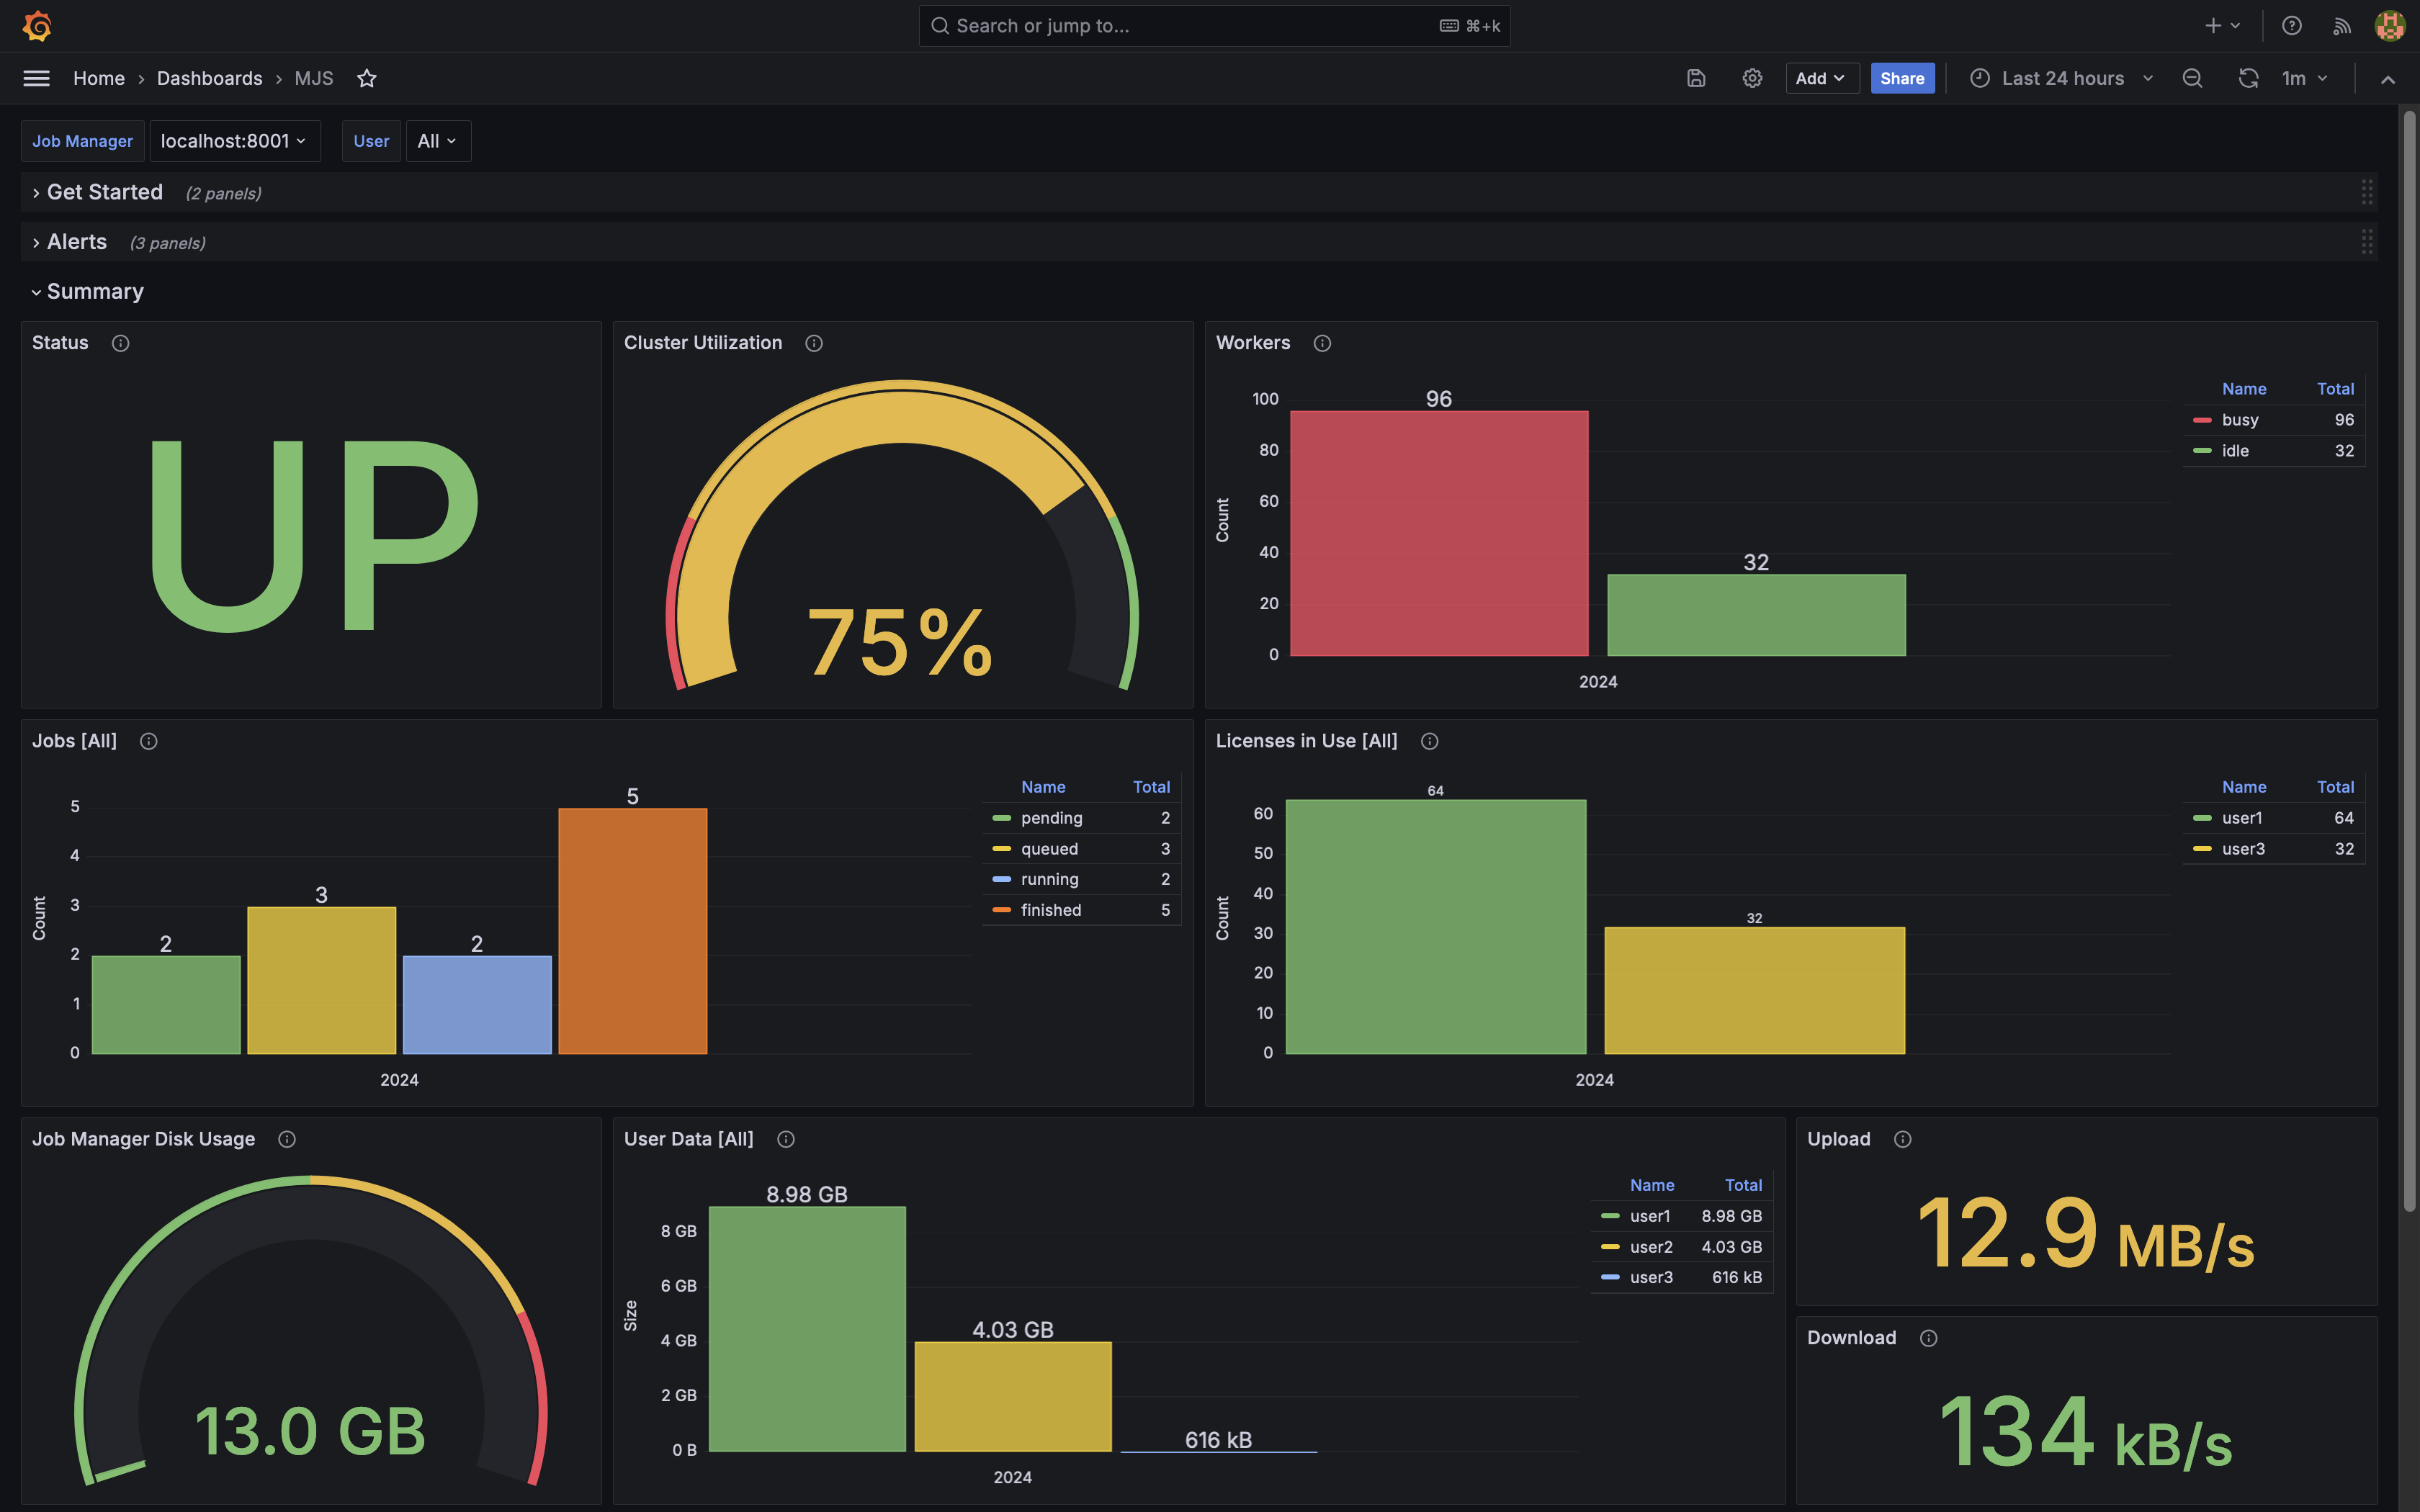
To check that Grafana is set up successfully, open the MJS dashboard and expand the Summary row. The Status panel displays UP if you have configured everything correctly and the job manager is running. If the status is DOWN and there is a warning triangle in the Status panel, it is likely you have configured the Prometheus data source in Grafana incorrectly. If the status is DOWN without a warning triangle and the job manager is running (you can confirm this using the nodestatus command), it is likely you have not set up Prometheus correctly.
From Grafana, navigate to the MJS dashboard to see live cluster monitoring data and alerts.
The license is available in the license.txt file in this repository.
If you require assistance or have a request for additional features or capabilities, contact MathWorks Technical Support.
Copyright 2024 The MathWorks, Inc.