This repository includes general information, notes and personal files relevant to the research topic
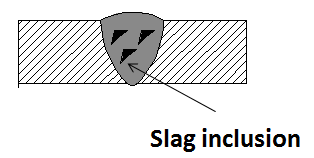
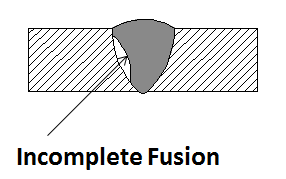
Weld defects can occur due to numerous and various reasons, which will be discussed here later. There are many types of weld defect, but the ones that we are interested in are the following: Crack (CR), Porosity (PO), Undercut (UC), Incomplete Penetration (IP), Slag (Sl) and Lack of Fusion (LF). These may later be referred to by the given acronyms. An accurate identification of the defect is essential, since the remedy depends solely on the defect type. In order to gather information about the particular weld, ultrasound testing is generally used:
 |
|---|
| A simplified ultrasound test set-up for reference |
The obtained data is the 1D-signal information of the particular weld. These data can be mapped out over the weld area in order to obtain 2D-data about the weld. Here are the typical causes of the defect types of our interest:
Causes:
- Use of hydrogen when welding ferrous metals.
- Residual stress caused by the solidification shrinkage.
- Base metal contamination.
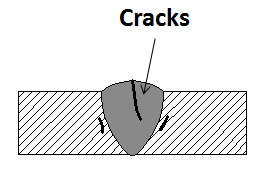
- High welding speed but low current.
- No preheat before starting welding.
- Poor joint design.
- A high content of sulfur and carbon in the metal.
Causes:
- Inadequate electrode deoxidant.
- Using a longer arc.
- The presence of moisture.
- Improper gas shield.
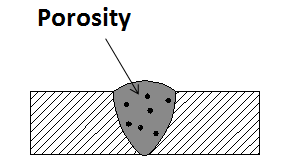
- Incorrect surface treatment.
- Use of too high gas flow.
- Contaminated surface.
- Presence of rust, paint, grease or oil.
Causes:
- Too high weld current.
- Too fast weld speed.
- The use of an incorrect angle, which will direct more heat to free edges.
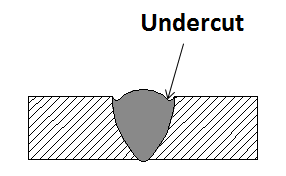
- The electrode is too large.
- Incorrect usage of gas shielding.
- Incorrect filler metal.
- Poor weld technique.
Causes:
- There was too much space between the metal you’re welding together.
- You’re moving the bead too quickly, which doesn’t allow enough metal to be deposited in the joint.
- You’re using a too low amperage setting, which results in the current not being strong enough to properly melt the metal.
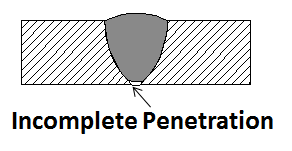
- Large electrode diameter.
- Misalignment.
- Improper joint.
Causes:
- Improper cleaning.
- The weld speed is too fast.
- Not cleaning the weld pass before starting a new one.
- Incorrect welding angle.
- The weld pool cools down too fast.
- Welding current is too low.
Causes:
- Low heat input.
- Surface contamination.
- Electrode angle is incorrect.
- The electrode diameter is incorrect for the material thickness you’re welding.
- Travel speed is too fast.
- The weld pool is too large and it runs ahead of the arc.
Data obtained from the PAUT is the intensity level signal information, which is a 1D data. This data can be mapped over the range width of the metal to obtain the intensity map of the signal, which is the 2D data. The difference in data types provides a certain flexibility with respect to training methods.
The acquired data has a massive weight imbalance, with the data distribution being 0.88:0.03:0.02:0.04:0.01:0.01 for NO:CR:IP:LF:PO:Sl:UC. The huge amount of data for Normal category is natural, since only limited areas of the sample have defects. Still, Porosity, Undercut and Slug categories have a sizable lack of data with respect to rest of data, but this cannot be adjusted. The data weights had been manually balanced before training, but the unavailability of the data for several defects still presents inherent problems in training.
The disadvantage of both 1D convolutional neural network and simple 2D image classification is that it is naturally bounded with the binary outcome; however, it is technically possible that multiple defects are present on the same width of a sample.
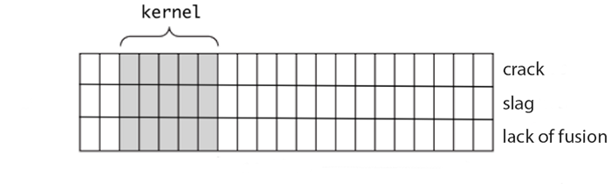
- In 1D convolution, kernel slides only in 1 direction
- 1D CNN can perform signal recognition and classification from the given categories of data.
| 3 sample PAUT signal data for various defects | A kernel of a sample 1D convolution |
|---|---|
 |
 |
| CR | IP | LF | NO | PO | Sl | UC | Total Accuracy |
|---|---|---|---|---|---|---|---|
| 0/96 | 0/64 | 140/171 | 290/290 | 0/30 | 0/20 | 0/28 | 61% |
The high accuracy is the result of the data imbalance and high accuracy in categories with higher amount of data. Since most categories do not even get classified, the 1D classification was deemed to be an unsuitable method, and thus has been dropped.
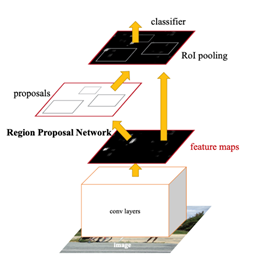
For sake of possible deployment, I deemed implementing models that can detect multiple objects as essential. For this reason, I implemented the Facebook Detectron2 Faster R-CNN. Just like its alternatives like YOLO, it works around the region based CNN, with the extra Region Proposal Network (RPN) at the last layer, which allows region proposal. RPNs are designed to efficiently predict region proposals with a wide range of scales and aspect ratios.A Region Proposal Network (RPN) takes an image (of any size) as input and outputs a set of rectangular object proposals, each with an objectness score.
Each feature point in the last convolutional layer of RPN is an anchor. For each anchor, nine kinds of anchor boxes can be pre-extracted using three different scales and three different aspect ratios. Compared with YOLO's two pre- dicted bounding boxes, the anchor boxes of Faster R-CNN take into account the objects with different scales and aspect ratios. Here is the link to Detectron2 official Github.
 |
|---|
| RPN Network |
Data has been divided with k-fold cross validation in mind in order to remove possibility of biased results. The model had been successfully implemented and I trained the data with it. The following shows what the sample output of Detectron2 FRCNN looks like:
| Sample output of proposal boxes, single object detected | Sample output of proposal boxes, multiple objects detected |
|---|---|
 |
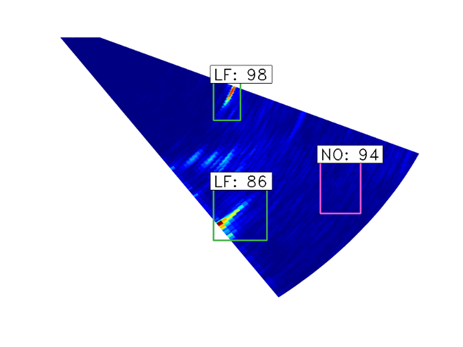 |
Detectron2 allows much easier custom data training than many other similar models, due to an easier loader function builder. It must be different for different annotation formats, but you can find the sample annotation file and loader function among the files.