![]()
![]()
DeepSeeWeb is an Angular UI layer for IRIS BI (DeepSee) dashboards
Detailed information about map usage can be found here: Map widget
To use old map widget (will be removed in future versions) add oldmap=1 to query parameters.
In DSW version 4.0.13 map widget has been changed:
- widget was rewritten to use GeoJSON as base format
- widget was simplified, for easy usage without need of complex configuration
- by default widget uses world GeoJSON, if no custom GeoJSON provided
- added auto-detection of markers mode, map can switch modes(polygons/markers) based on data provided
- popup was replaced with tooltip and tooltip now always visible during hovering
- tooltip now display all data for marker/polygon, no need to set up custom tooltip field(custom tooltip still supported)
- fixed issue when tooltip can be rendered offscreen, now tooltip always shown in bounds of widget frame
- improved performance
- added new design for tooltip
- some data properties no longer supported
- migrated to Angular 18:
- rewritten application to use lazy loading, as a result "main.js" size reduced from 3Mb to 500Kb
- all javascript modules in dist package now take up 3Mb, instead of 5Mb(previous version)
- templates now uses new control flow
- removed deprecated ComponentFactoryResolver, now dynamic component created using NgComponentOutlet
- added many interfaces and types to make type checks and reduce runtime errors
- updated addon systems to work with new Angular
- now new Angular 18 builder is used
- rewritten a lot of code
- updated HighCharts to 11.4, now it have new look
- rewritten charts data parser to support crossjoins/hierarchical data on all axis
- fixed issue with a thousand separator and float numbers when there is no format specified
- fixed issue with combo chart when only one series type specified
- fixed issue when user tries to show legend for widget with one series(legend for widget with one series always hidden, check #346). now if user enable legend it always visible even if there is only one series
- changed method of widget type change. now complex charts can be viewed as another complex chart, eg. "stacked chart" > "multiple pie charts"
- fixed styles for error message
- added new color picker
- fixed issue with dashboard folder item text color change
- fixed issue with changing color of pie/treemap/timechart series, also fixed issues with changing color on legend items
- changed application font to "Oxygen"
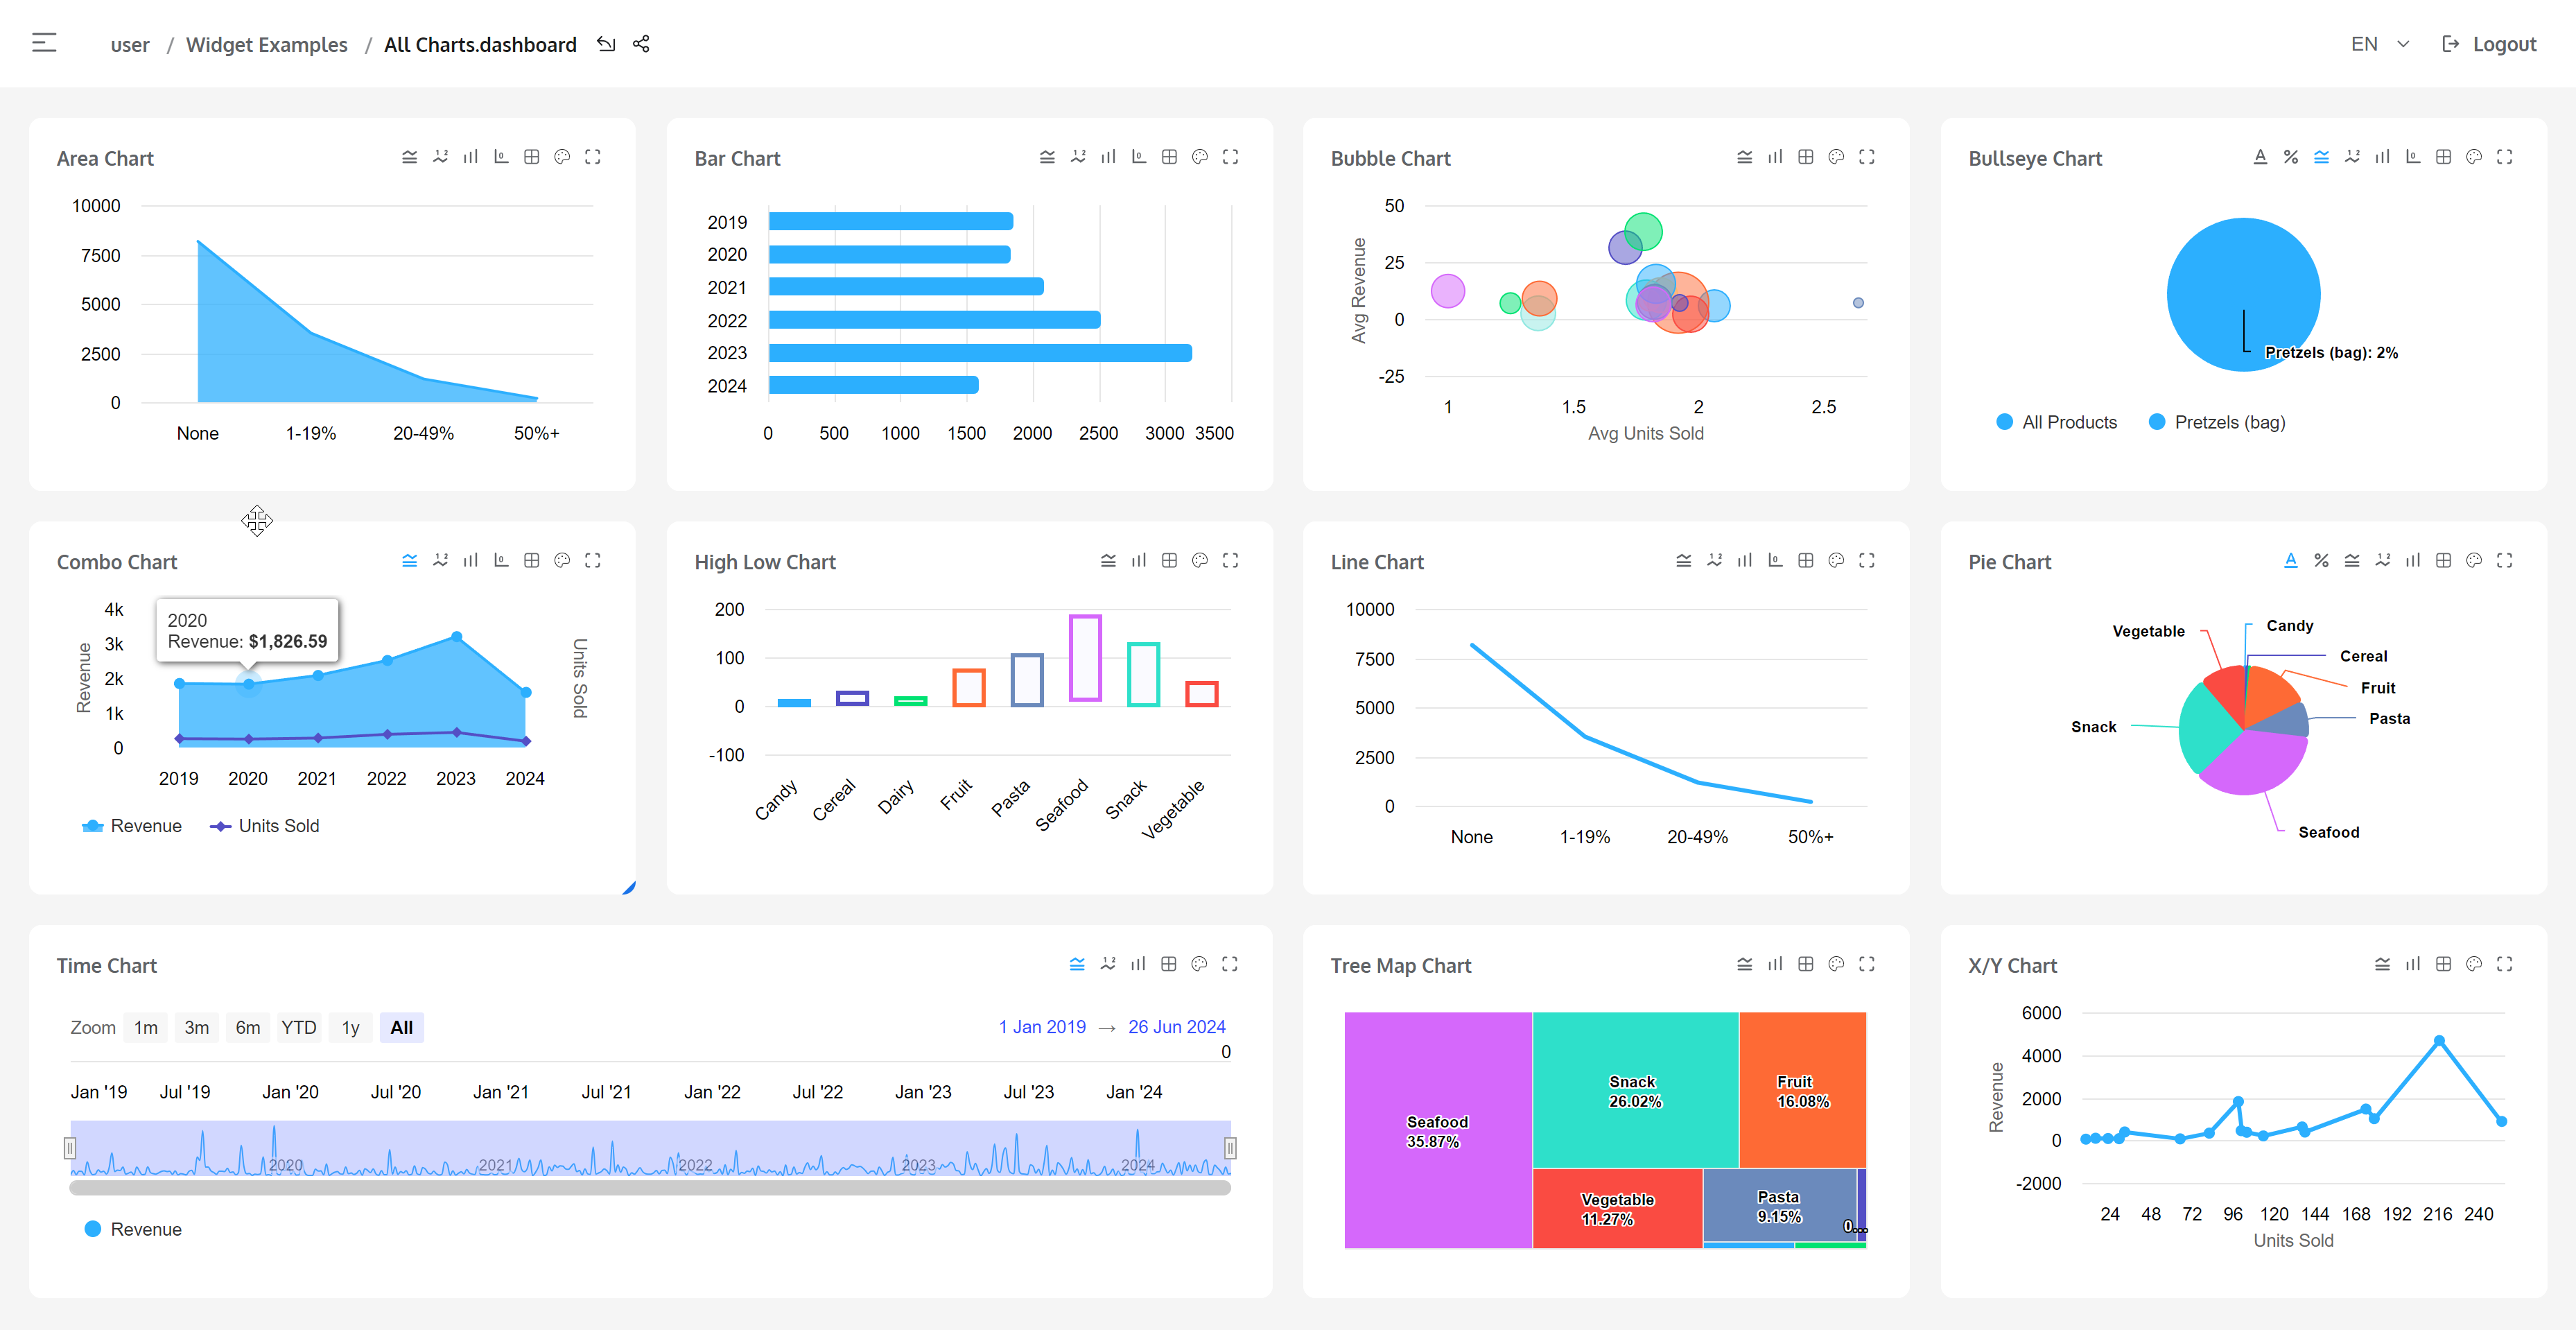
Note, that new charts looks a bit different, also new font helps with readability. Compare UI of DSW 3.x vs DSW 4.x:
DSW 3.x
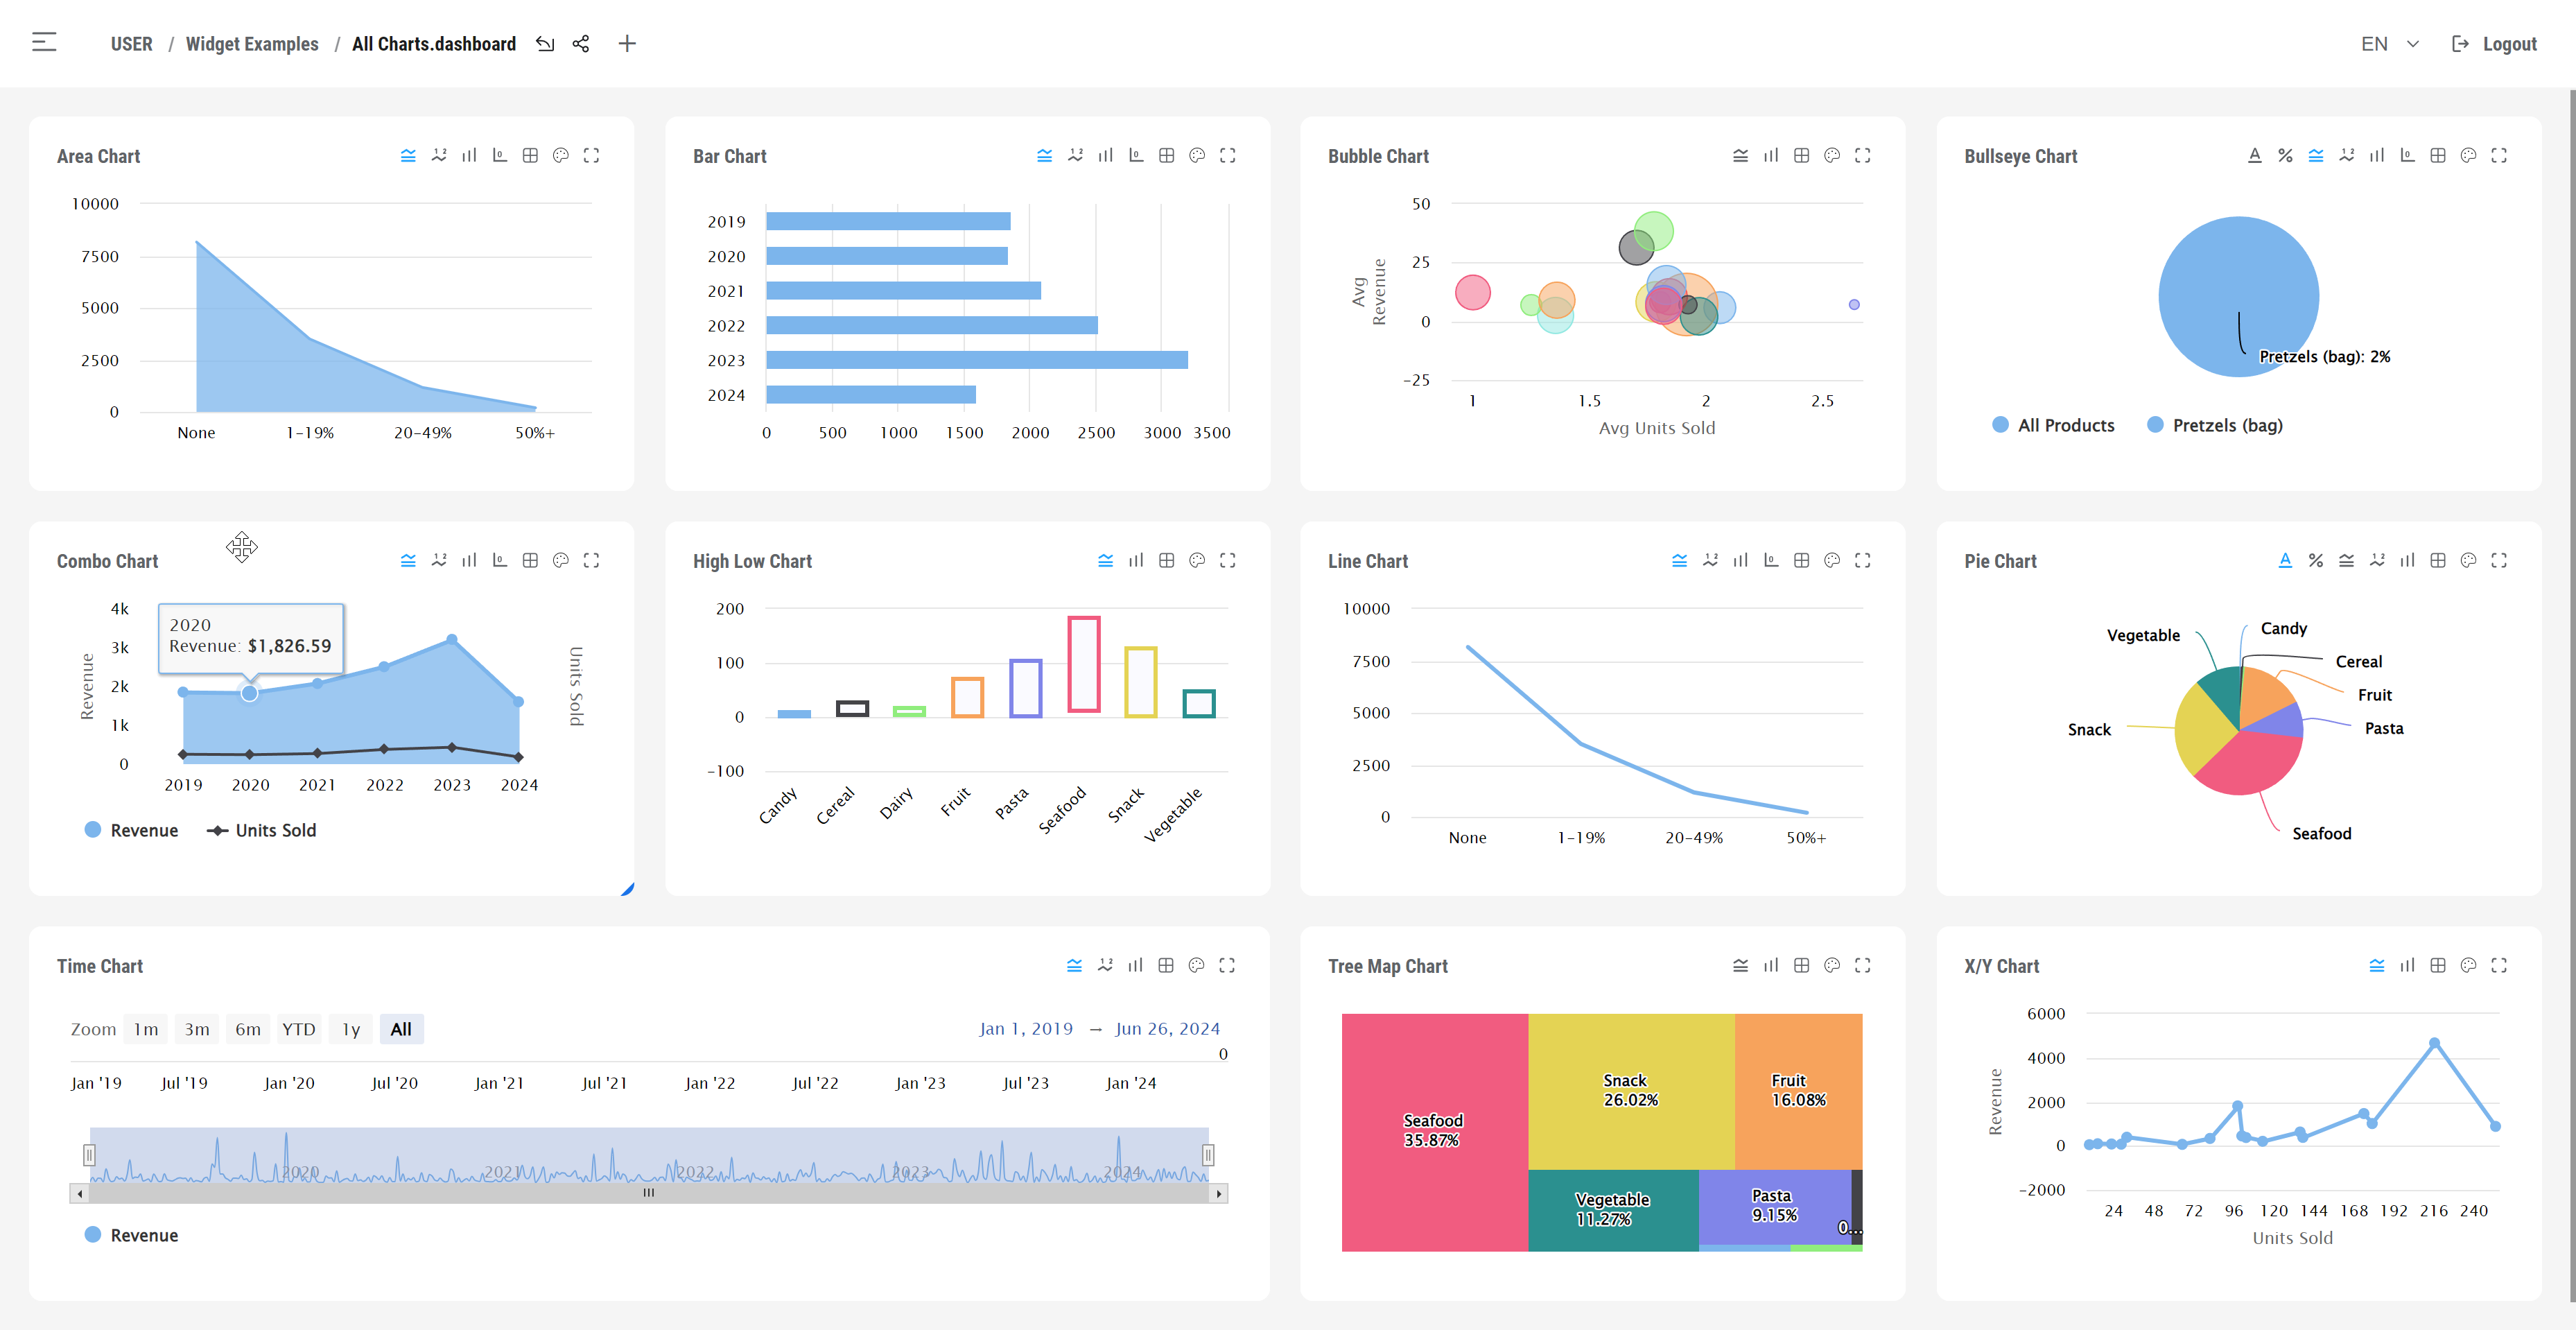 DSW 4.x
This is newly rewritten DeepSeeWeb with TypeScript & Angular 10!
Current version is alpha!
Some features of new version:
- Clean navigation

Now user can clearly see and navigate to dashboards via breadcrumbs, changing namespace, etc. Query parameter "ns" for namespace was gone. Now url constructed by following rule "/namespace/folder/folder/.../dashboard.dashboard", eg. http://mysite.com/dsw/#/IRISAPP/Test/Countries.dashboard
- Redesigned login screen

- New sidebar with main menu

Now user can easly see options available for each screen and change settings

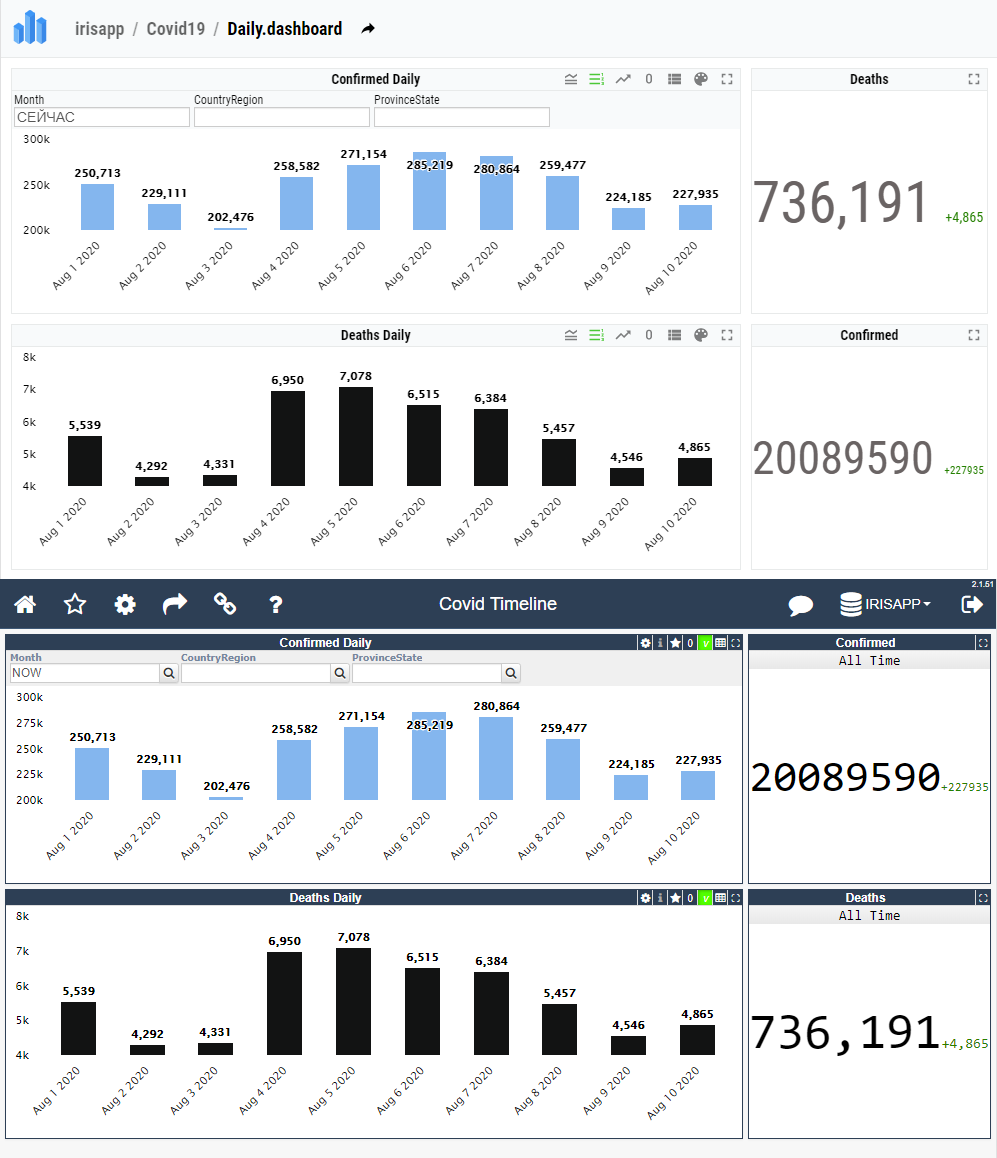
- More clean dashboards. Colors adjusted to show important data, whilst other information displayed in light colors. Also new design is more suitable for large screens. Top - new design, buttom - old:
- Clean widget actions

- Redesigned styles for filters, modals
- Added service workers to improve application startup
- Now all libs(eg. Highcharts, gridster) can be easily updated via npm
- Removed a lot of old code(300k+ lines) and refactored services
- Changed widget classes to more OOP style, removed all prototypes, etc.
- Changed templates to take advantage of component approach
- user addons, beacuse old addons has been written on Angular1 (but base addons as map, html text, worldmap are included in bundle already)
- changing app settings via UI(only configs supported)
- color adjustments and theming
- some specific widget settings or features(eg. changing type of chart)
This features will be implemented soon and are to be included in RC
- Area chart
- Line chart
- Chart with markers
- Bar chart
- Column chart
- Pie chart
- Time chart
- Pivot table
- Text widget
- Combo chart
- Bubble chart
- Hi-Low chart
- Quadtree chart
- Bullseye chart
- Speedometer
- Fuel gauge
- Install IPM
- Use IPM to install DSW, run in Iris session terminal:
zpm "install dsw"
You can set your endpoint and namespace in an appropriate file config.json located in the root directory
Sometimes after installation you can see umlyauts in the client. like in the shot:
 To fix this there are tow ways:
- Copy index.html to index.csp and try to connect to it same way you do with index.html page. Symbols should go in Unicode now.
Or:
- Write your current codepage setting in CSP Gateway for the files:
zw ^%SYS("CSP","DefaultFileCharset")
This setting should be "utf-8". If there is another setting, save it somewhere and change to "utf-8"
So this should fix it:
set ^%SYS("CSP","DefaultFileCharset")="utf-8"
Widgets can be embedded in other pages. Easiest way to embed a widget is to navigate to the widget, set it into a desired state, press RMB to open context menu and press Share button. It would show a url for embedding.
Embedded URL is generated as follows. Start with a dashboard URL and add required widget parameter. Optionally add other URL parameters. All parameter values MUST be URL escaped. Available parameters are:
| Name | Value | Value, escaped | Description |
|---|---|---|---|
| widget | 1 | 1 | Which widget from the dashboard to show (in order of widget definition). |
| FILTERS | TARGET:*;FILTER:[period].[H1].[period].&[10\] |
TARGET:*;FILTER:%5Bperiod%5D.%5BH1%5D.%5Bperiod%5D.%26%5B104%5D |
Filters to use. Follows InterSystems BI FILTERS url parameter. |
| variables | variable1.value1variable1.value1~variable2.XYZ |
variable1.value1variable1.value1~variable2.XYZ |
Provide pivot variable values. Variables are separated by ~. Variable and value are separated by .. |
| drilldown | level1level1~level2[regionD].[H1].[regionL].&[23]~[regionD].[H1].[rayonL].&[56043] |
level1level1~level2%5BregionD%5D.%5BH1%5D.%5BregionL%5D.%26%5B23%5D~%5BregionD%5D.%5BH1%5D.%5BrayonL%5D.%26%5B56043%5D |
Drilldown on a widget. Drilldown levels are separated by ~. |
| noheader | 1 |
1 |
Do not display header information. Defaults to 0. |
| datasource | map/weights.pivot |
map%2Fweights.pivot |
What datasource to use for widget. |
Embedded widgets interact with a parent in two ways:
- Communicate with parent window using event passing via
dswobject for shared widgets:
// Define dsw object in a parent window using this interface:
export interface IDSW {
    onFilter: (e: IWidgetEvent) => void;
    onDrill: (e: IWidgetEvent) => void;
}
// Widget event
export interface IWidgetEvent {
    index: number;
    widget: IWidgetInfo;
    drills?: IWidgetDrill[];
    filters?: string;
}

// Example:
window.dsw = {
    onDrill: (data) => {
         // handle drill event here
    },
    onFilter: (data) => {
         // handle filter event here
    }
}- Communicate with parent window using postMessage (supports CORS and crossdomain setup where DSW and parent app are on a separate servers/domains):
// Extended interface for widget event
export interface IWidgetEvent {
    type: WidgetEventType;
    index: number;
    widget: IWidgetInfo;
    drills?: IWidgetDrill[];
    filters?: string;
    datasource?: string;
}

// Example listener in parent
window.addEventListener('message', e => {
    const event = e.data as IWidgetEvent;
    switch (event.type) {
        case 'drill':
            // code ...
            break;
        case 'filter':
            // code ...
            break;
        case 'datasource':
            // code ...
            break;
    }
});- Apply styles for map widget
  // hide map controls, assuming widget in iframe element
iframe.postMessage({ type: 'map.applyStyle', selector: '.ol-control', style: 'display', value:'none' });- Disable context menu on widgets
Use
disableContextMenu=1data property to disable DSW context menu on any widget. Also, context menu can be disabled on shared widget by passing url parameterdisableContextMenu=1
Map can show polygons or markers depending on data source. If data contains latitude/longitude fields map will display markers, otherwise polygons are shown.
Without setting GeoJSON file, will use bundled /assets/countries.json file with world countries.

To create a map widget you'll need:
- Get a polygon file. GeoJSON is supported, and there's also support for a legacy js format. Widget can use bundled
/assets/countries.jsonfile by default if no custom file exists on server. For default mode ignore step 2. - Save a polygon file into a root directory of a default web application of your namespace.
- Create a widget with type:
mapand name equal to the GeoJSON file. For default mode name doesn't matter. - If you want to use specific name of widget but still able to load polygon file, use
polygonFiledata property with value equal to file name of polygons file. - Prepare data source for map. Data source formats described here: map data source.
- Setup data properties if needed.
Map widget can work with following data sources:
-
Simple data variant 1.
Keys(name of a country) defined as Axis 2, Axis 1 contain numeric value
-
Simple data variant 2.
Axis 1 contains pairs
[country-name, value], Axis 2 can hold anything -
Complex data
-
Markers data. Data with latitude/longitude fields
In this mode map will display simple data.
Axis 2 must contains countries names and Axis 1 contains numeric values:
Example:
Axis 1: "Count"
Axis 2: "Iceland", "Madagascar", "Venezuela"
| Iceland | 12 |
| Madagascar | 15 |
| Venezuela | 10 |
Axis 1 contains pairs [country-name, value], Axis 2 can hold anything.
Example:
Axis 1: "Name", "Count"
Axis 2: "Id 1", "Id 2", "Id 3"
| Id 1 | Iceland | 12 |
| Id 2 | Madagascar | 15 |
| Id 3 | Venezuela | 10 |
In this mode map can use any data source to display polygons. But some fields must exists in data source to be able to link data with polygons and display colors.
Required fields:
- "Key" - field used to link data record with GeoJSON polygon
nameproperty. - "Value" - field contains numeric value used to color polygon. Color of polygon is a gradient from green(minimum value) to red(maximum value).
You can use field with different names as well. In this case use key/value data properties and define field names as values of these properties respectively.
Example 1:
| Custom1 | Key | Value | Custom2 | |
|---|---|---|---|---|
| Id 1 | 10 | Iceland | 12 | test1 |
| Id 2 | 20 | Madagascar | 15 | test2 |
| Id 3 | 30 | Venezuela | 10 | test3 |
Example 2:
| Custom1 | Field33 | Field44 | Custom2 | |
|---|---|---|---|---|
| Id 1 | 10 | Iceland | 12 | test1 |
| Id 2 | 20 | Madagascar | 15 | test2 |
| Id 3 | 30 | Venezuela | 10 | test3 |
Data property key = "Field33", data property value = "Field44"
Map can display markers(pins) on coordinates specified in data.
 Widget data source, must contain fields
 Latitude/Longitude in EPSG:4326 projection.
You can use field with different names as well. In this case use latitude/longitude data properties and define field names as values of these properties respectively.
Other fields can hold any data. This data will be displayed in a marker tooltip:

Example 1:
| Revenue | Latitude | Units Sold | Longitude | |
|---|---|---|---|---|
| Id 1 | 1032.32 | 51.53 | 12 | 4.86 |
| Id 2 | 2045.46 | 52.35 | 15 | -122.09 |
| Id 3 | 5630.12 | 47.67 | 10 | -76.59 |
Example 2:
| Revenue | Lat | Units Sold | Lon | |
|---|---|---|---|---|
| Id 1 | 1032.32 | 51.53 | 12 | 4.86 |
| Id 2 | 2045.46 | 52.35 | 15 | -122.09 |
| Id 3 | 5630.12 | 47.67 | 10 | -76.59 |
Data property latitude = "Lat", data property longitude = "Lon"
Map supports following data properties, that can be used for customization:
| Data Property | Type | Description | Value | Default |
|---|---|---|---|---|
| key | dataproperty | Define custom name of key field. Value from this field used to link data to GeoJSON polygon name property |
Datasource column name | "Key" |
| value | dataproperty | Define custom name of value field. Value from this field used to calculate color of polygon | Datasource column name | "Value" |
| tileUrl | dataproperty | Tile server URL | https://tile-c.openstreetmap.fr/hot/{z}/{x}/{y}.png | |
| polygonFile | dataproperty | File name with a JS or GeoJSON polygons. Requested from the root of a default web app for a namespace | Path with filename | Widget name |
| latitude | dataproperty | Define custom name of latitude field. Used for marker mode | Datasource column name | "Latitude" |
| longitude | dataproperty | Define custom name of longitude field. Used for marker mode | Datasource column name | "Longitude" |
| tooltip | dataproperty | Define name of field with custom tooltip text. Tooltip appears when user's cursor hovers over a polygon or marker. | Datasource column name | "TooltipValue" |
| coordsJsFile | deprecated | Use polygonFile instead |
||
| tooltipProperty | deprecated | Use tooltip instead |
Datasource column name | Row name |
| coordsProperty | deprecated | Use key instead |
Datasource column name | |
| colorProperty | deprecated | Use value instead |
No longer supported:
| Data Property | Type | Description | Value | Default |
|---|---|---|---|---|
| popupProperty | deprecated | Define custom popup. Tooltip appears when user's cursor presses LMB on a polygon and there's no DRILLDOWN. | Datasource column name | Row name |
| colorFormula | deprecated | Formula used to calculate polygon color. | hsl((255-x)/255 * 120, 100%, 50%) rgb(x, 255-x, 0) |
|
| polygonTitleProperty | deprecated | Define custom polygon title | Datasource column name | |
| markerPopupContentProperty | deprecated | Deprecated by a popupProperty dataproperty | ||
| colorClientProperty | deprecated | Deprecated by a colorProperty dataproperty |
DeepSeeWeb allows modification of exist widgets and custom widget registration as well.
For base widget class methods and properties description please read Addons.
To setup custom widget simply copy widget js file to /addons folder.
For custom widget example, please look at src/factories/customWidget.js. This is simple custom widget that represents html5 canvas for drawing.
User can create or use custom themes, more about it here: Custom themes.
Though DeepSeeWeb source goes with MIT License it uses hicharts.js for visualisation of several widgets so please obey the Highcharts license when use DeepSeeWeb for commercial applications. According to Highcharts license it's free for non-commercial usage
At least NodeJS v16.14.0 required to build application.
- Run
npm i - Run 'npm run build'
distfolder will contain built app
Here is the article on InterSystems Developer Community describing DSW features and capabilites.