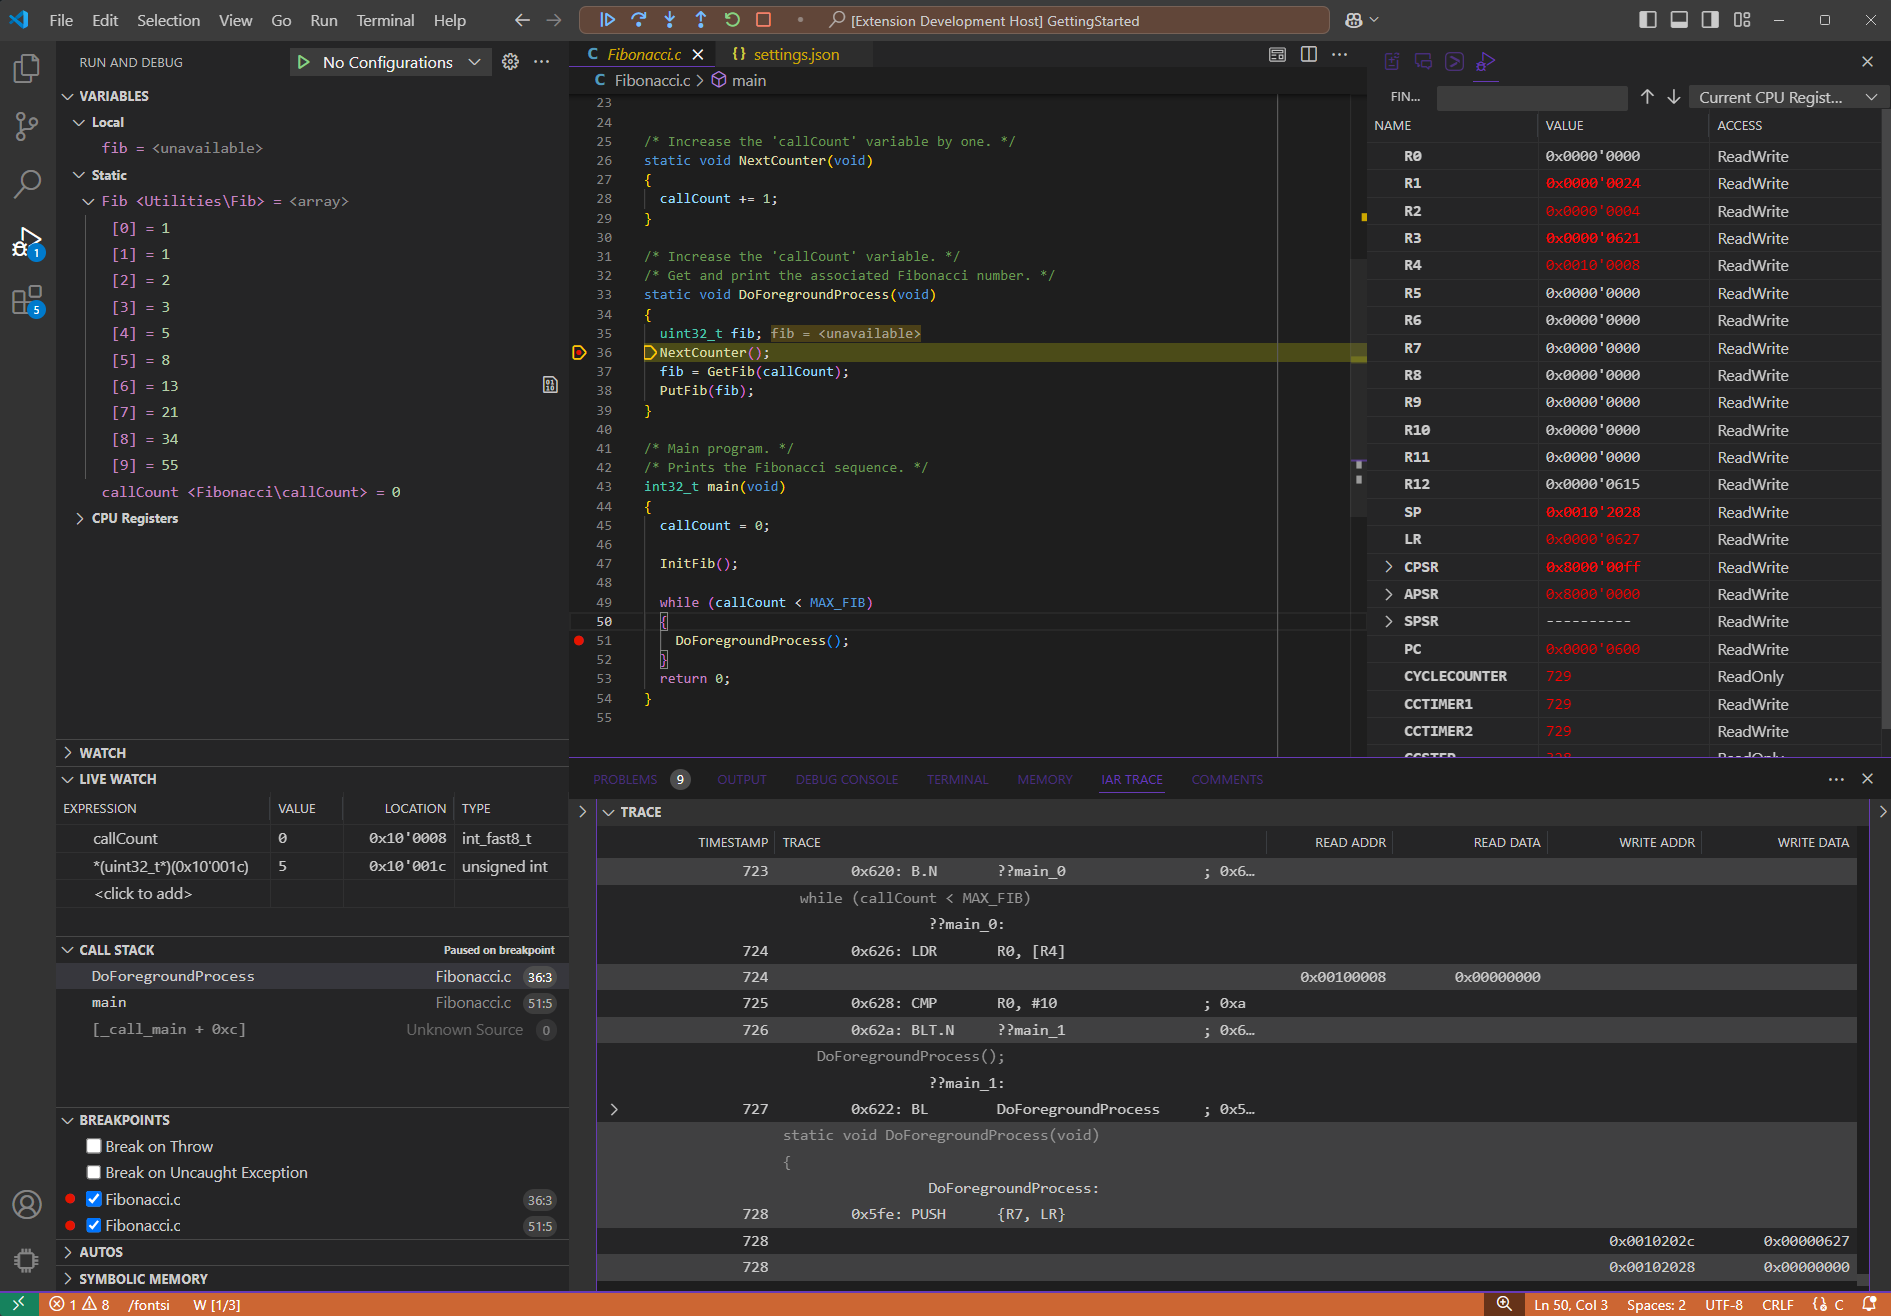
Debug your applications with the IAR C-SPY Debugger in Visual Studio Code with the IAR C-SPY Debug extension. The IAR C-SPY Debugger features support for a wide range of embedded devices and debug probes. This extension can be used for debugging programs created from IAR Embedded Workbench projects (*.ewp, *.ewd), or from 3rd party build systems such as CMake.
An IAR Embedded Workbench or IAR Build Tools installation is required to use this extension. See the Compatibility section below for detailed information.
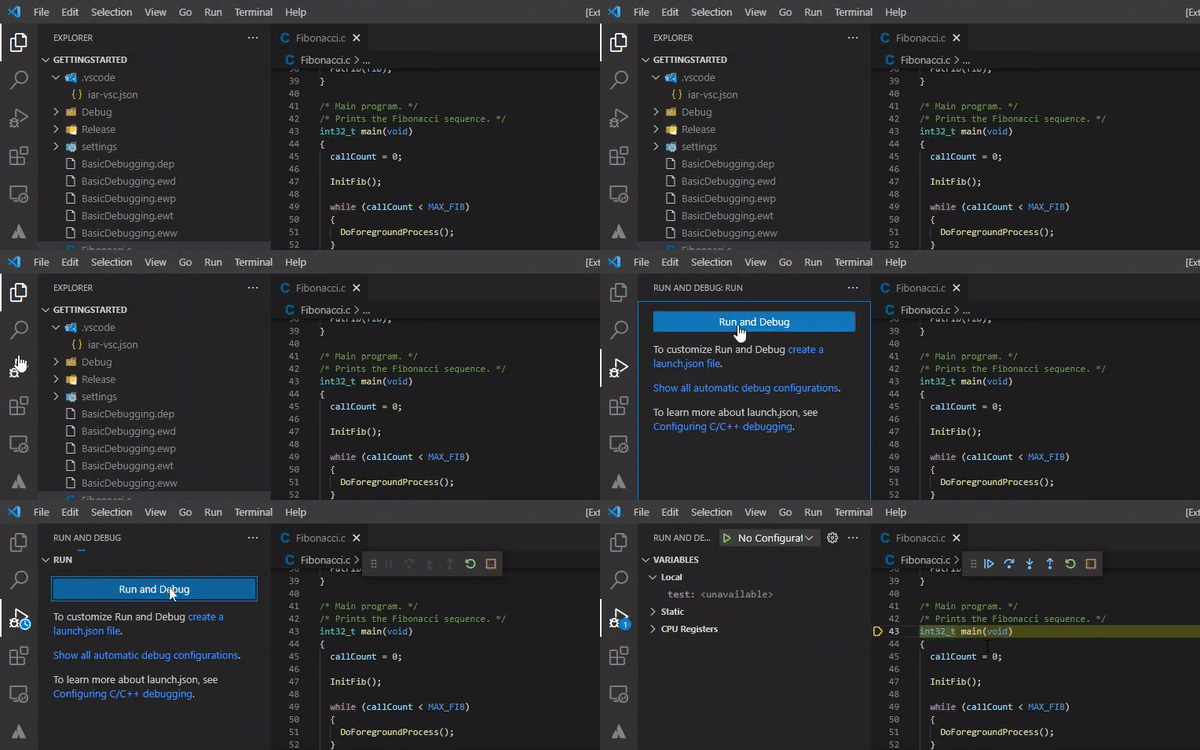
For the best experience, install the IAR Build extension. The IAR C-SPY Debug extension will then automatically provide debug configurations taken from the IAR Embedded Workbench project (*.ewp, *.ewd). Simply switch to the Run and Debug view, press the Run and Debug button, and start debugging the current executable.
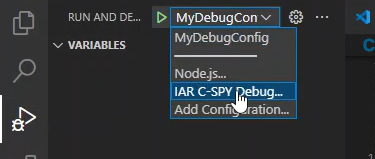
Visual Studio Code stores debug configurations for its current workspace in the .vscode/launch.json configuration file. If the workspace already has a .vscode/launch.json file, choosing IAR C-SPY Debug... in the debug configuration dropdown menu will offer debug configurations generated for your project.
There are two ways for creating the .vscode/launch.json configuration file when debugging a program built from a 3rd party build system, such as CMake:
- Follow the instructions for generating a launch.json configuration from a separate IAR Embedded Workbench project with the desired target and probe selections and copy the generated
.vscode/launch.jsonconfiguration file to the workspace. - Create the configuration yourself. Please see the reference for the launch.json format.
For more help, see Debugging a stand-alone application.
Click here to view the full documentation.
This extension is compatible with selected versions of the IAR Embedded Workbench (EW) or IAR Build Tools (BX) installations. The table below lists known limitations of this extension concerning earlier versions of both IAR products for each supported target architecture:
| Target architecture | Product Version | Known Limitation |
|---|---|---|
| Arm | v9.60.2 or later | None. |
| Arm | v9.50.1-9.50.2 | IAR Build Tools on Linux and IAR Embedded Workbench only. |
| Arm RISC-V AVR RH850 RL78 RX |
v8.40.1-9.40.2 v3.10.1 or later v8.10.1 or later v3.10.1 or later v5.10.1 or later v5.10.1 or later |
IAR Embedded Workbench on Windows only. |
| RISC-V | v3.10.1 | Terminal I/O is not supported. |
| Arm RH850 |
v8.50.1-9.20.4 v3.10.1 or later |
A prior debug session launched from EW is initially required before launching a debug session in VS Code. |
| Arm RH850 |
v8.40.1-9.10.2 v3.10.1-3.10.2 |
Multicore debugging instability, leading to potential crashes. |
| Arm | v8.40.1-8.50.10 | The variables view is not supported. |
If you are unable to launch a debug session in Visual Studio Code, rule out any unrelated issues by verifying that debugging in IAR Embedded Workbench works. Depending on the type of feedback you want to share with us, here are our preferred options:
-
For urgent matters with the extension, or if you have issues with the underlying IAR Embedded Workbench or IAR Build Tools product, report them via the IAR Technical Support channel.
-
For other matters isolated to this extension, file a New issue using the provided template. We will reply on a "best effort basis".
-
If you have ideas on how to improve this extension, see CONTRIBUTING.md on how to proceed.


