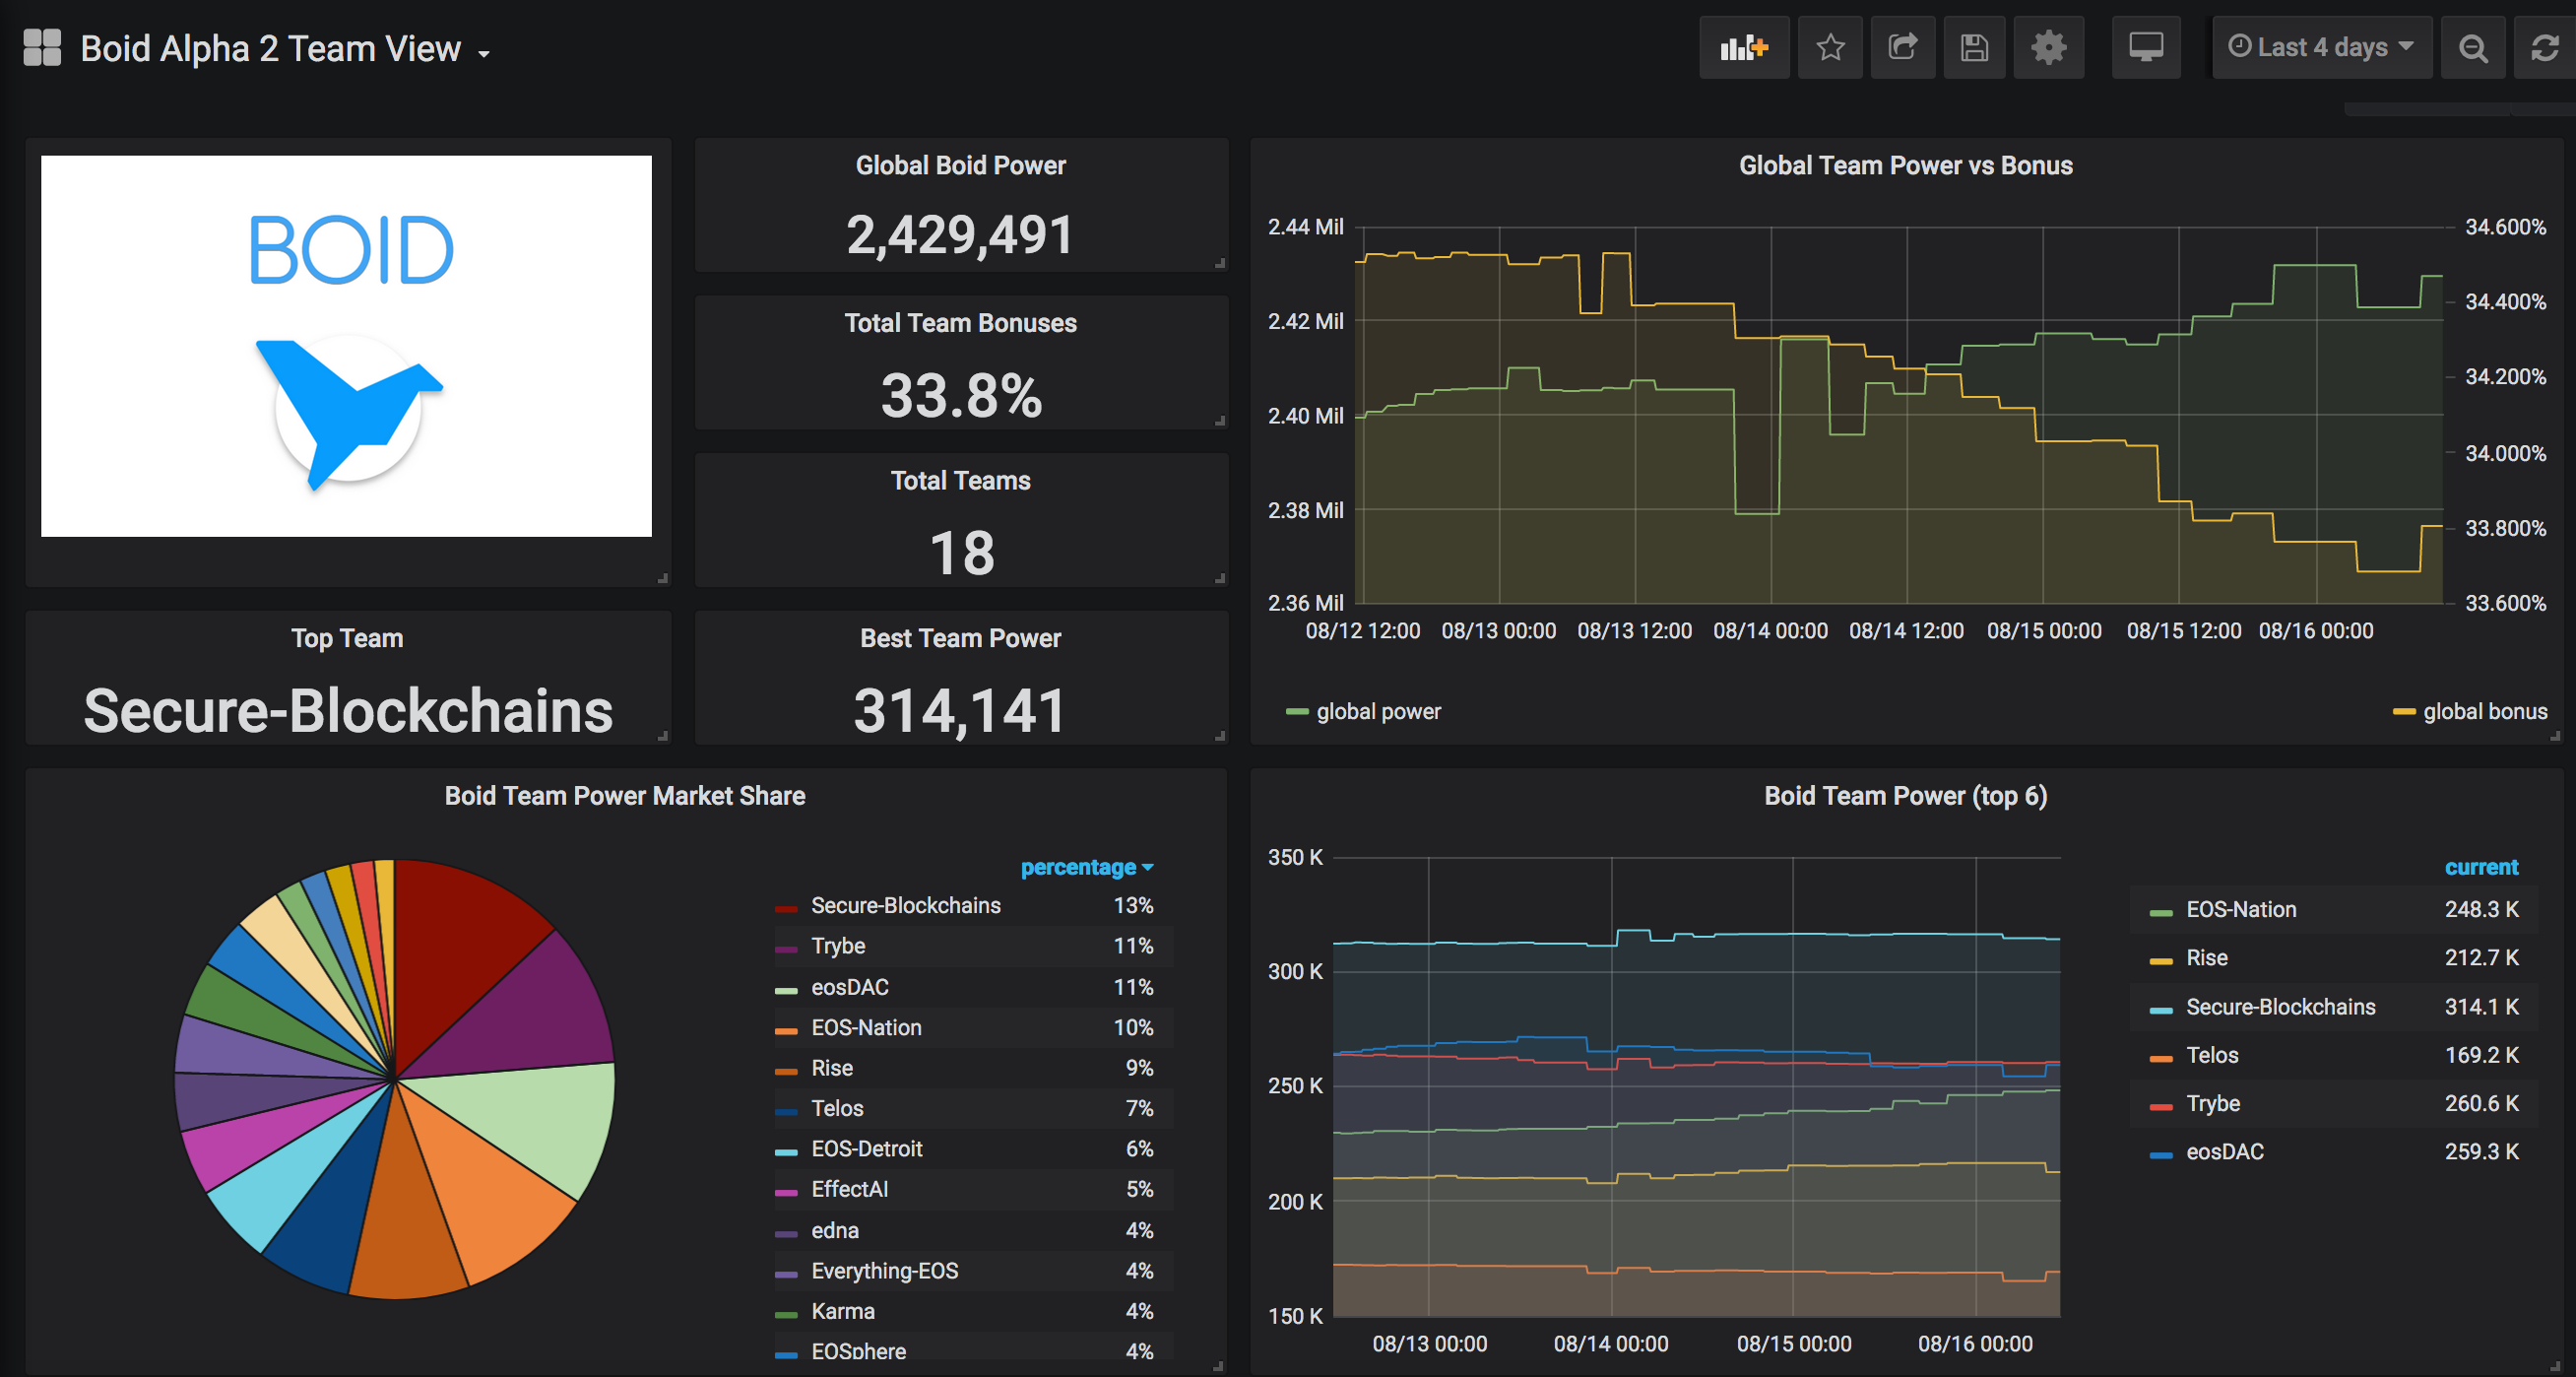
This repo is just some work I have done to visualize the boid.com global statistics. If you have any comments or feedback don't hesitate to open a github issue.
This is still very much work in progress, and not considered production ready yet.
I tested this on Ubuntu 16.04LTS , but this should work on any debian/ubuntu flavored OS.
grab the latest version of prometheus , pushgateway and grafana
wget https://github.com/prometheus/prometheus/releases/download/v2.11.1/prometheus-2.11.1.linux-amd64.tar.gz
wget https://github.com/prometheus/pushgateway/releases/download/v0.9.1/pushgateway-0.9.1.linux-amd64.tar.gz
wget https://dl.grafana.com/oss/release/grafana_6.3.2_amd64.deb
I have provided a sample prometheus.yml file in this repo pushgateway does not require any configuration so you can start it first.
I then started prometheus as follows:
prometheus --config.file /etc/prometheus/prometheus.yml --storage.tsdb.retention.time 90d --storage.tsdb.path /var/spool/prometheus --web.enable-lifecycle --web.enable-admin-api &>/var/log/prometheus/prometheus.log
Note: Feel free to use longer retention times if need be.
install grafana ( and configure it with a decent good admin password see grafana docs )
dpkg -i grafana_6.3.2_amd64.deb
Now you need to grab your personal boid.com account bearer token, I have provided a helper script for this purpose:
./boidGrabMyToken.sh myboidemail@address mypassword
It will show some curl output with at the end the following example token:
{"token":"yourlongtokenidxxxxxxxxxxxxxxxxxx","id":"cjyourdeviceidxxxx"}
set this token in the other scripts boidAPIcheck.sh and GrabTeamLeaderBoard.sh they will have a variable called TOKEN inside them that need to be set.
Now you can test it out by calling:
./GrabTeamLeaderBoard.sh
If all goes well this should show you the boid.com leader board stats. BoidToProm.py requires the following python modules: requests and prometheus_client
apt install pip
pip install requests
pip install prometheus_client
You are ready to setup the cronjob, see samples-cron.txt
WARNING: Do not run this too fast, boid.com only updates every hour or so.
Log into grafana configure the datasource to use your local prometheus server on 127.0.0.1:9090 and you are now ready to import the sample grafana dashboard , I have provided in this repo.
If you like this feature you can always send me some referals ;) https://app.boid.com/u/ghobson
