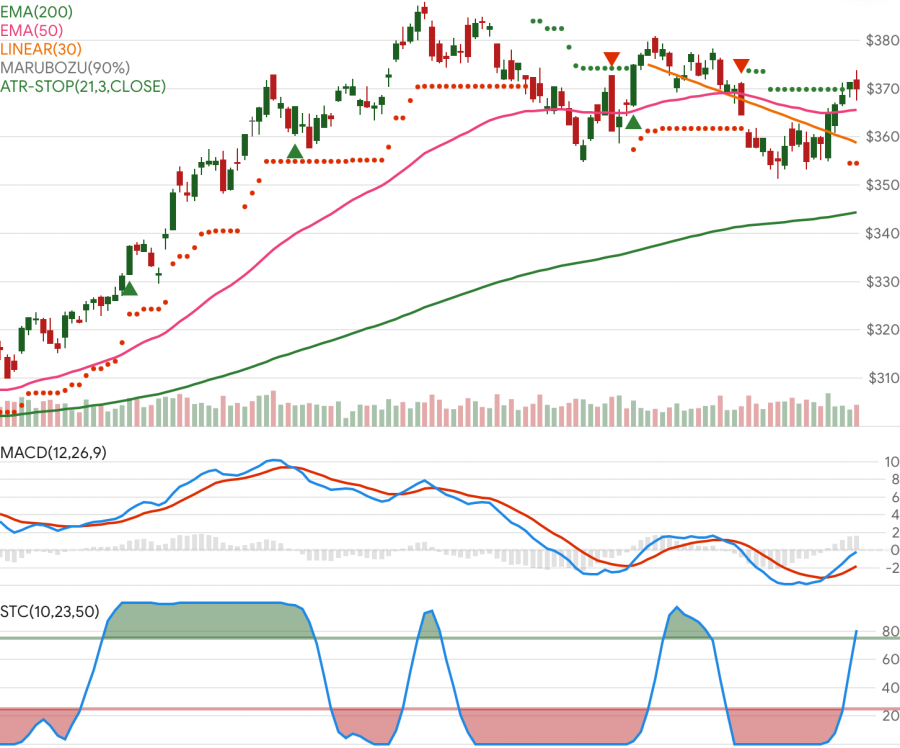
A demo showcasing the Skender.Stock.Indicators NuGet package with an Angular frontend, Chart.js charting, and a .NET Web API backend for financial indicators. See the library documentation for more examples, guides, and available indicators.
Live demo: charts.StockIndicators.dev
This repo and charting tool is primarily intended to demonstrate the Stock Indicators for .NET library. It is not meant to be a fully featured charting system and may not be an architectural model that works for your use case. If you need a mature charting tool, please explore all of your charting and visualization options.
- Git and Node.js (v24 LTS or later)
- pnpm (v10.27.0 or later) - Install with
npm install -g [email protected] - .NET SDK (v10.0 or later)
- Visual Studio Code (recommended) or Visual Studio
# Clone and install
git clone https://github.com/facioquo/stock-charts.git
cd stock-charts
pnpm install

# Start development environment
# Option 1: Use VS Code
# Ctrl+Shift+P → "Tasks: Run Task" → "start-full-stack"

# Option 2: Manual start in separate terminals
pnpm run azure:start  # Terminal 1: Storage emulator
cd server/Functions && func start  # Terminal 2: Azure Functions
cd server/WebApi && dotnet run  # Terminal 3: Web API
pnpm start  # Terminal 4: Angular dev server
Access: Website at http://localhost:4200, Web API at https://localhost:5001, Functions at http://localhost:7071
For detailed development setup, testing, linting, formatting, and contribution workflow, see Contributing Guidelines.
This project is licensed under the Apache 2.0 License - see LICENSE for details.