4. Development Workflow
Use the Dev Containers's Reopen in Container that shows in the Commands Palette (macOS ⌘ + ⇧ + P, Windows/Linux Ctrl + ⇧ + P). and select the corresponding container:
- Sound Detector
- Playback Distributor
- Sound Player
- Journal
Important
Tip: You can open new VS Code windows and open them into the various containers
and develop simultaneously the various modules, and they will be interconnectedly and
able to speak to one another by their service names, e.g. pinging
playback-distributor from the sound detector container.
Check the environment variables that are set as default in the Dockerfile and also
have a look at the environment: overrides in the docker-compose.development.yaml as
well as the build args.
Note
Tip: If you want to manipulate environment without rebuilding the container simply
run the command in the terminal e.g.
LOGGING_LEVEL=DEBUG USE_TFLITE=1 python main.py inference or modify the launch
debugpy or node-terminal action to have that modified environment.
Note
When committing your git changes do it from a window that is not running in the container for two reasons:
- The container might have trouble with the SSH configuration when pushing. HTTP might work perhaps?
- The container does not mount everything, only specific paths, so in the eyes of git it would see many files disappeared!
Warning
Do not continue unless you opened VS Code within the container with
Dev Container: Reopen in Container action.
In the sidebar, click Run and Debug (macOS ⌘ + ⇧ + D, Windows/Linux Ctrl + ⇧ + D) and run the Debug Sound Detector launch action. This will run the application and it will stop at the breakpoints you set.

If you want a Python interpreter, on the VS Code Terminal run ipython, which has
nice features such as autocompletion, syntax highlighting, editing multi-line
statements, and more.
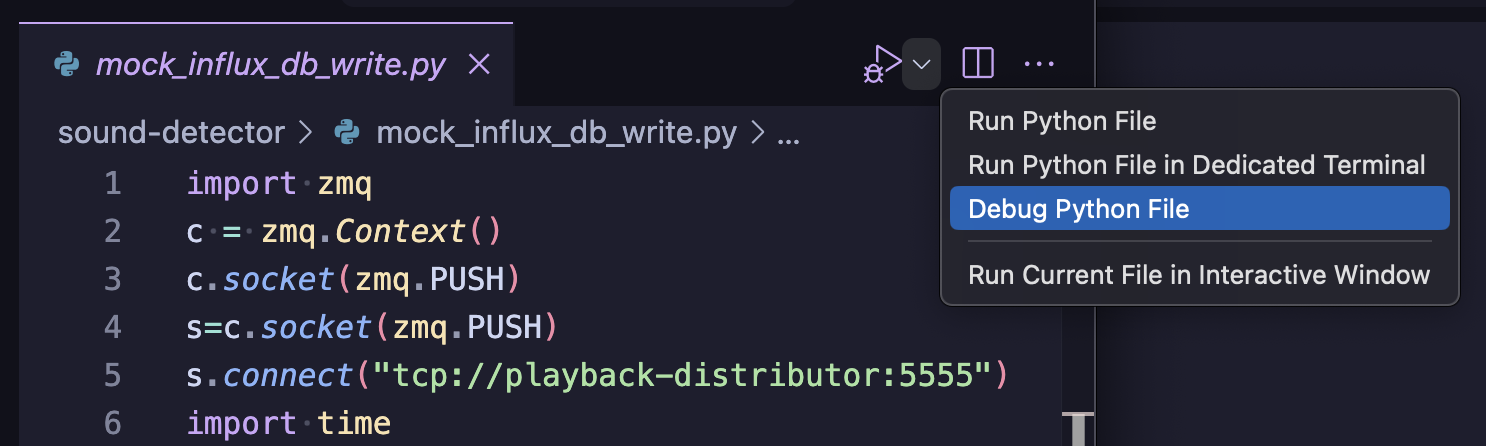
Other times you might want to run a single file when writing snippets of code to integrate later on on the larger code base, for that the Debug Python File action at the upper right of the code window is very helpful
For running the tests, under the testing sidebar icon run them as follows:

Warning
Do not continue unless you opened VS Code within the container with
Dev Container: Reopen in Container action.
Run the app by heading on the CMake Tooks on the left sidebar and click either Launch or Debug, the latter when if you set up some breakpoints.

Note
If you opened, for instance, the Taconez Playback Distributor Dev Container and in
the CMakeTools Debug you see the sound-player target it might be because you might
have previously built the sound-player target from the Tazonez Sound Player Dev
Container, to fix this click on the pencil icon (see the image below) and select the
correct target for the container you are in:

A selector will show up asking what compiler kit do you want to use, there's only one, which is Alpine's GCC.

Another handy way to debug the executable is by clicking the debug target on the footer:

Run the tests by clicking on Testing on the left sidebar and choose whether to run them or debug them.
Note
Debugging in taconez C projects won't work. It's probably missing a launch configuration for the tests. Keep an eye on the GitHub issue I created for it. This does not affect the regular Run though! So you can use that.

An alternative to debug the executable is to use the launch configuration provided by clicking (in the sidebar) Run and Debug (macOS ⌘ + ⇧ + D, Windows/Linux Ctrl + ⇧ + D) and runing the Debug Sound Distributor/Player launch action, but for this you must have run first the Debug build with the CMake Tools as explained above.

A Launch Configuration called Journal App under
.devcontainer/journal/devcontainer.json
is provided and can be run from the Run and Debug sidebar menu item or from the
bottom status bar after running VS Code inside the container with Dev Containers: Reopen in Container > Taconez Journal.
If you run the Docker Compose directly with CLI or indirectly by opening in VS Code the
project in a container then you can access http://localhost:8086 to manage the
InfluxDB database. The credentials are in the influx-db-server in
docker-compose.yaml
under DOCKER_INFLUXDB_INIT_USERNAME and DOCKER_INFLUXDB_INIT_PASSWORD.