crabby is a website performance tester that measures page load times and reports the measurements to a collection endpoint for processing, monitoring, and viewing. Crabby can collect and report these metrics:
- DNS resolution time
- TCP connection time
- TLS negotiation time
- HTTP Response Code
- Remote server processing time
- Time to first byte (TTFB)
- Server response time
- DOM rendering time
Crabby currently supports five types of metrics delivery:
- Graphite - Time measurements as metrics using Carbon protocol over TCP or UDP
- Datadog API - Time measurements as metrics; HTTP response codes as service check
- Prometheus - Time measurements as metrics, made available through a Prometheus endpoint.
- Riemann - Time measurements as metric events; HTTP response codes as state events
- InfluxDB - Time measurements as metrics using the InfluxDB wire protocol over HTTP
Crabby has two types of probes for measuring website performance:
-
simple, which uses Go's built-in client,net/http, to conduct simple HTTPGETrequests. These requests measure server performance metrics,including TLS negotiation time for HTTPS. This probe fetches the full response for a URL but will not fetch objects reference by that page. Thesimpleprobe is appropriate for measuring app/API availabililty, time-to-first-byte (TTFB), DNS lookups, and TCP connection time. Being headless, it cannot measure DOM rendering time. If you only intend to runsimplechecks, you do not need to configure Selenium in yourconfig.yaml.* -
selenium, which uses the Selenium API to conduct browser-based performance tests via Chrome/chromedriver. Theseleniumtest is appropriate when page render time measurement is the primary concern. These tests will pull down the page along with all objects included in the page. Due to limitations of chromedriver, the probe does not support reporting of TLS negotiation time or the HTTP response code. Being browser-based, this probe has much higher resource (CPU, RAM) requirements than thesimpleprobe and therefore, is not suggested for use on a typical cloud instance. You'll need something closer to a desktop-class machine for this probe and even then, you may need to limit the number of pages that you test concurrently.
Crabby currently supports four protocols for metrics delivery: Graphite, Prometheus, Datadog, and Riemann:
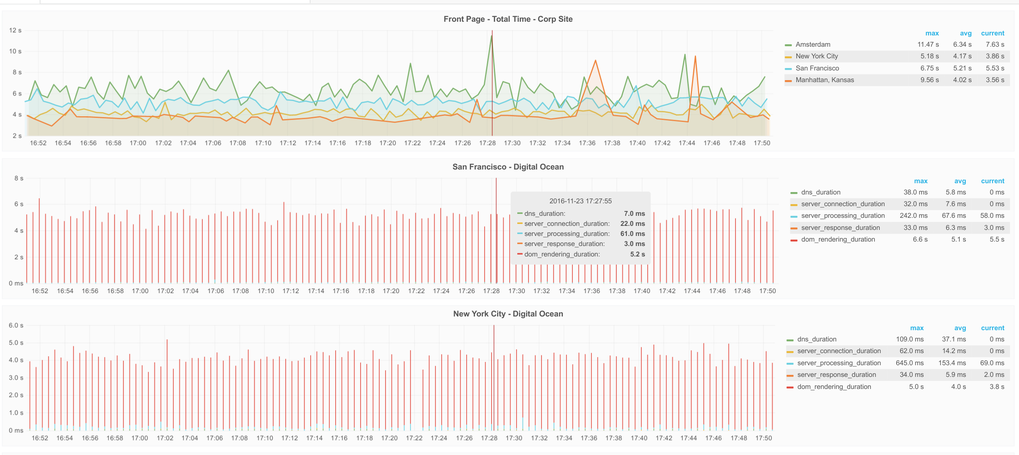
Crabby speaks the Carbon protocol via TCP or UDP for sending performance metrics to remote Graphite servers. This is a great way to centrally collect metrics from multiple, geographically dispersed Crabby POPs. Using a tool like Grafana, you can consolidate those metrics onto a single dashboard and have a very powerful way of looking at your website performance. Revinate uses Crabby installations around the globe to keep tabs on their performance as our customers experience it:
Crabby has first-class support for Prometheus. Crabby exposes a Prometheus endpoint that provides all gathered metrics. The config.yaml in the examples directory will get you started. Crabby applies global and per-job tags (if configured) as labels.
Crabby can send metrics to InfluxDB over HTTP/HTTPS. This is implemented using Influxdata's "v2" client for InfluxDB 1.x. Crabby can talk to InfluxDB directly or you can stand up a Telegraf instance to relay the metrics to InfluxDB (or some other datastore).
Crabby has experimental support for sending metrics and events to Riemann. The config.yaml in the examples directory will get you started. The Riemann storage backend supports the addition of tags to your metrics
and events.
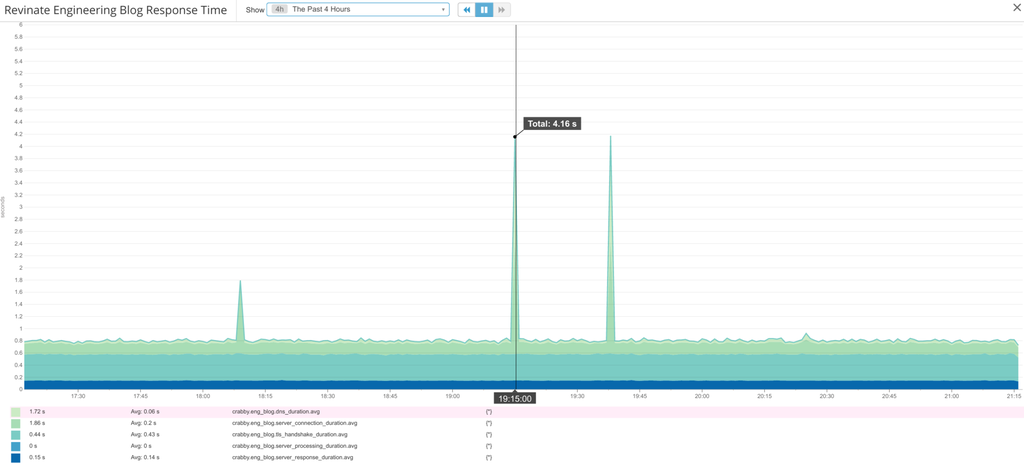
Crabby supports the sending of performance metrics to Datadog for use in graphical dashboards and alerting. Using Datadog's anomaly detection capability, you can even configure alerts to trigger when site performance suddenly degrades. When using the simple collector, Crabby can also collect HTTP response codes and send a failed service check to Datadog to trigger an alert if a 400- or 500-series error is detected.
Crabby supports sending metrics and events to Splunk via HTTP Event Collector. The config.yaml in the examples directory will get you started. The Splunk storage backend supports specifying the host, source and sourceType values for events and also to which index to append them.
Crabby can generate incidents based on failed jobs. Using the PagerDuty's V2 Events API, Crabby will generate an incident for jobs that result in a 4xx or 5xx response code. See CONFIGURATION.md for details on how to configure this storage backend.
Crabby is configured by a YAML file that you pass via the -config flag. If you don't pass the -config flag, Crabby looks for a config.yaml by default. This config file defines the sites to be tested (called "jobs"), as well as the metric storage destination(s) for the metrics that are generated (Graphite, Prometheus, etc.). Crabby supports multiple metric storage backends simultaneously so you could, for example, send metrics to InfluxDB while simultaneously making them available via the Prometheus endpoint.
For metrics storage backends that support them, Crabby supports tags, both global tags applied to all jobs and their metrics, and per-job tags that are applied to a single job's metrics. In the event of tag name conflicts, per-job tags will override global tags.
The easiest way to use Crabby is with Docker. This approach requires no compiling and you don't even have to go through the hassle of setting up Selenium, Chromium, and chromedriver because these are all available in an easy-to-use, all-in-one container. I always keep the latest version of Crabby available on Docker Hub but if you prefer to build your own images, I've included a Dockerfile in this repo and an entrypoint.sh to handle the startup.
There's also a docker-compose.yml in the example/ directory to get you started. By using Docker Compose, connecting Crabby to the Selenium server is really easy and requires no effort on your part.
To use Crabby in Docker, you'll need to mount your config.yaml Crabby configuration file into the container and set the CRABBY_CONFIG environment variable to the location where you mounted it. Again, the Docker Compose examples handle this for you so if you're unfamiliar with Docker volumes, I recommend using Compose.
If you prefer, I've uploaded some binaries to the Releases page for a variety of architectures. Have at it. After downloading the release, you can snag the config.yaml from the example/ directory to get started.
Crabby is configured by a YAML file that you pass via the -config flag (defaults to config.yaml).
See CONFIGURATION.md for a detailed description of this file. There is also an example, if you need one.
Please note that the format of config.yaml has changed with recent versions of Crabby. Here are some of the changes:
-
Two types of tags can now be configured: in the
generalsection, you can configure global tags that are applied to all metrics. In each job of thejobssection, you can apply per-job tags. -
The
hostname,location, andprovidergeneral options have been removed. If you wish to include these with your metrics, you can set them as tags. -
The Prometheus storage backend no longer supports Pushgateway. Going forward, Crabby now exposes a proper Prometheus endpoint than can be queried directly by your Prometheus infrastructure.
-
The
report-internal-metricsandinternal-metrics-gathering-intervalkeywords have been relocated to thegeneralsection.


