Observability refers to the ability to monitor, measure, and understand the state of a system or application by examining its outputs, logs, and performance metrics. In modern software systems and cloud computing, Observability plays an increasingly crucial role in ensuring the reliability, performance, and security of applications and infrastructure.
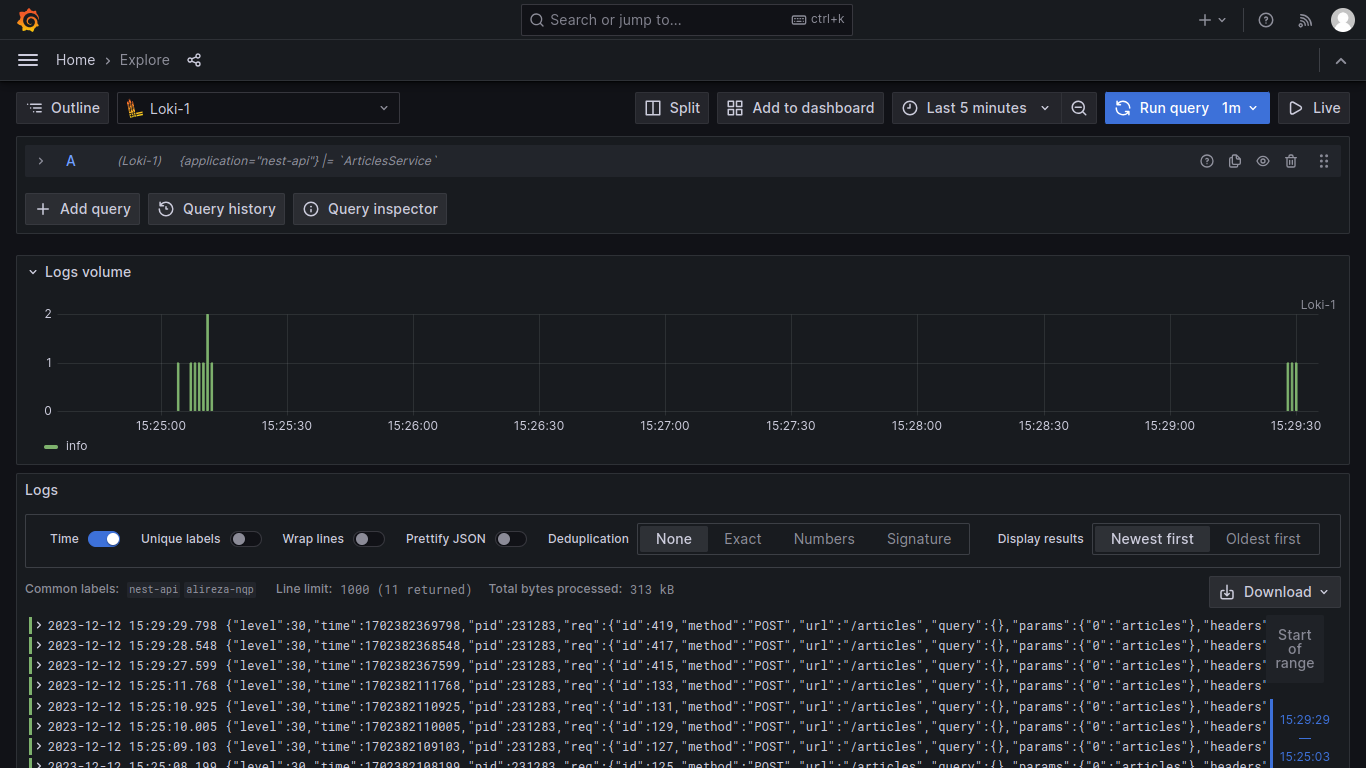
- Logs
- Metrics
- Tracing
Logs are discrete events with the goal of helping engineers identify problem area(s) during failures.
- Prometheus: Used for logging metrics.
- Loki: A horizontally-scalable, highly-available, multi-tenant log aggregation system.
- Grafana: For visualizing logs.
- Pino: Fast, low-overhead Node.js logger.
- Pino-Loki: Streams Pino logs to Loki.
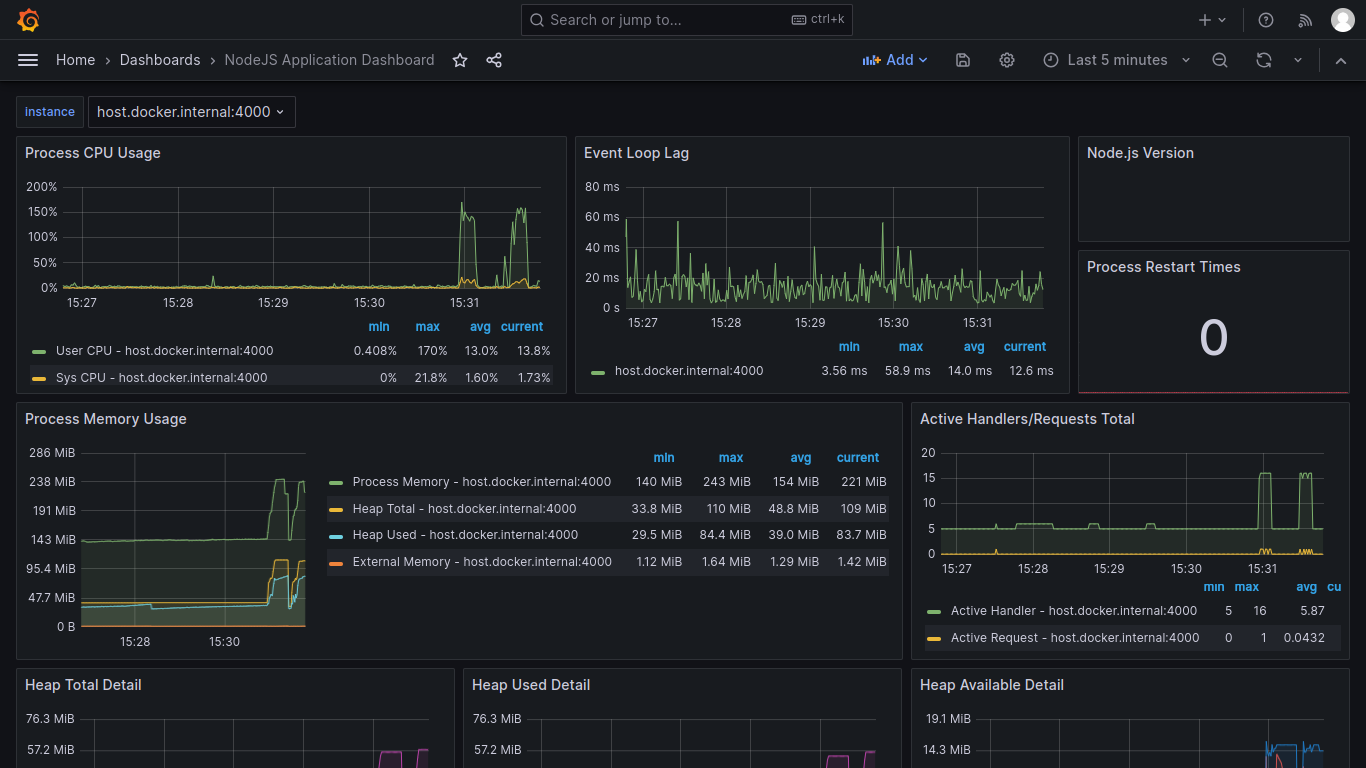
Metrics are numerical representations of data used to monitor and observe system behavior over time. You can use it to ensure the system performs as expected, identify potential problems, measure business goals, etc.
- Prometheus: An open-source monitoring system with a dimensional data model.
- Grafana: An open-source platform for monitoring and observability.
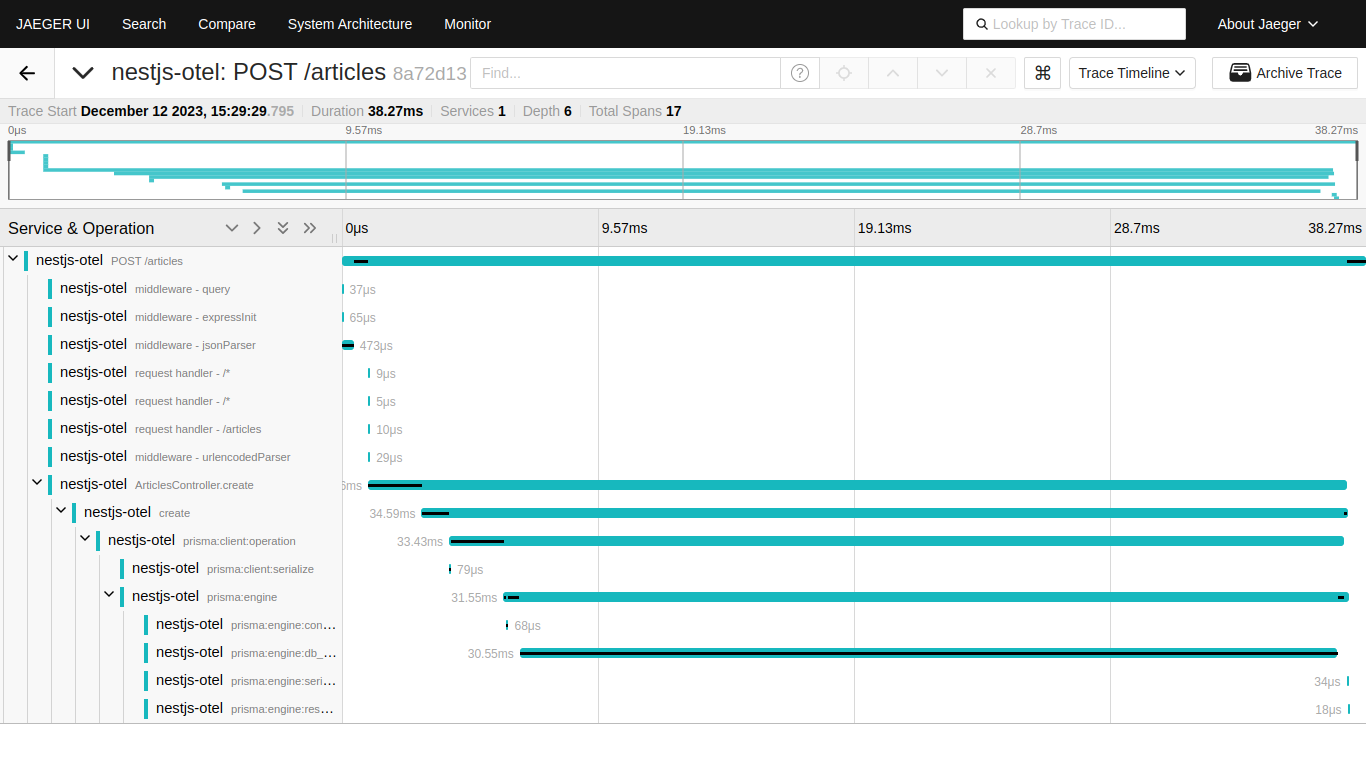
Tracing is an observability tool that records the path taken by a request as it propagates through your application(s). Traces help you link the activities that your system is performing in response to any particular request. Traces also provide timing information (e.g., start time, duration, etc.) about these activities.
- OpenTelemetry: Provides instrumentation for monitoring application performance.
- Jaeger: A distributed tracing system.
- add postgresql metrics
- add redis metrics