-
Notifications
You must be signed in to change notification settings - Fork 200
New issue
Have a question about this project? Sign up for a free GitHub account to open an issue and contact its maintainers and the community.
By clicking “Sign up for GitHub”, you agree to our terms of service and privacy statement. We’ll occasionally send you account related emails.
Already on GitHub? Sign in to your account
fix grafana dashboard and clarify dashboard usage more clearly. #543
base: master
Are you sure you want to change the base?
Conversation
| image: nvcr.io/nvidia/k8s/cuda-sample:vectoradd-cuda10.2 | ||
| resources: | ||
| limits: | ||
| nvidia.com/vgpu: 2 # requesting 2 vGPUs |
There was a problem hiding this comment.
Choose a reason for hiding this comment
The reason will be displayed to describe this comment to others. Learn more.
Should "nvidia.com/vgpu" be "nvidia.com/gpu"?
There was a problem hiding this comment.
Choose a reason for hiding this comment
The reason will be displayed to describe this comment to others. Learn more.
Should "nvidia.com/vgpu" be "nvidia.com/gpu"?
I forgot to explain it, it depends on our own case.
In order to distinguish from “nvidia.com/gpu” in nvidia-device-plugin, I used resourceName parameter and setted it's value to "nvidia.com/vgpu", such as: helm install hami hami-charts/hami --set resourceName=nvidia.com/vgpu --set scheduler.kubeScheduler.imageTag=v1.23.10 -n kube-system
|
@fangfenghuang Can you help review this pr? |
Codecov ReportAll modified and coverable lines are covered by tests ✅
Flags with carried forward coverage won't be shown. Click here to find out more. |
There was a problem hiding this comment.
Choose a reason for hiding this comment
The reason will be displayed to describe this comment to others. Learn more.
fix some http url
docs/dashboard.md
Outdated
|
|
||
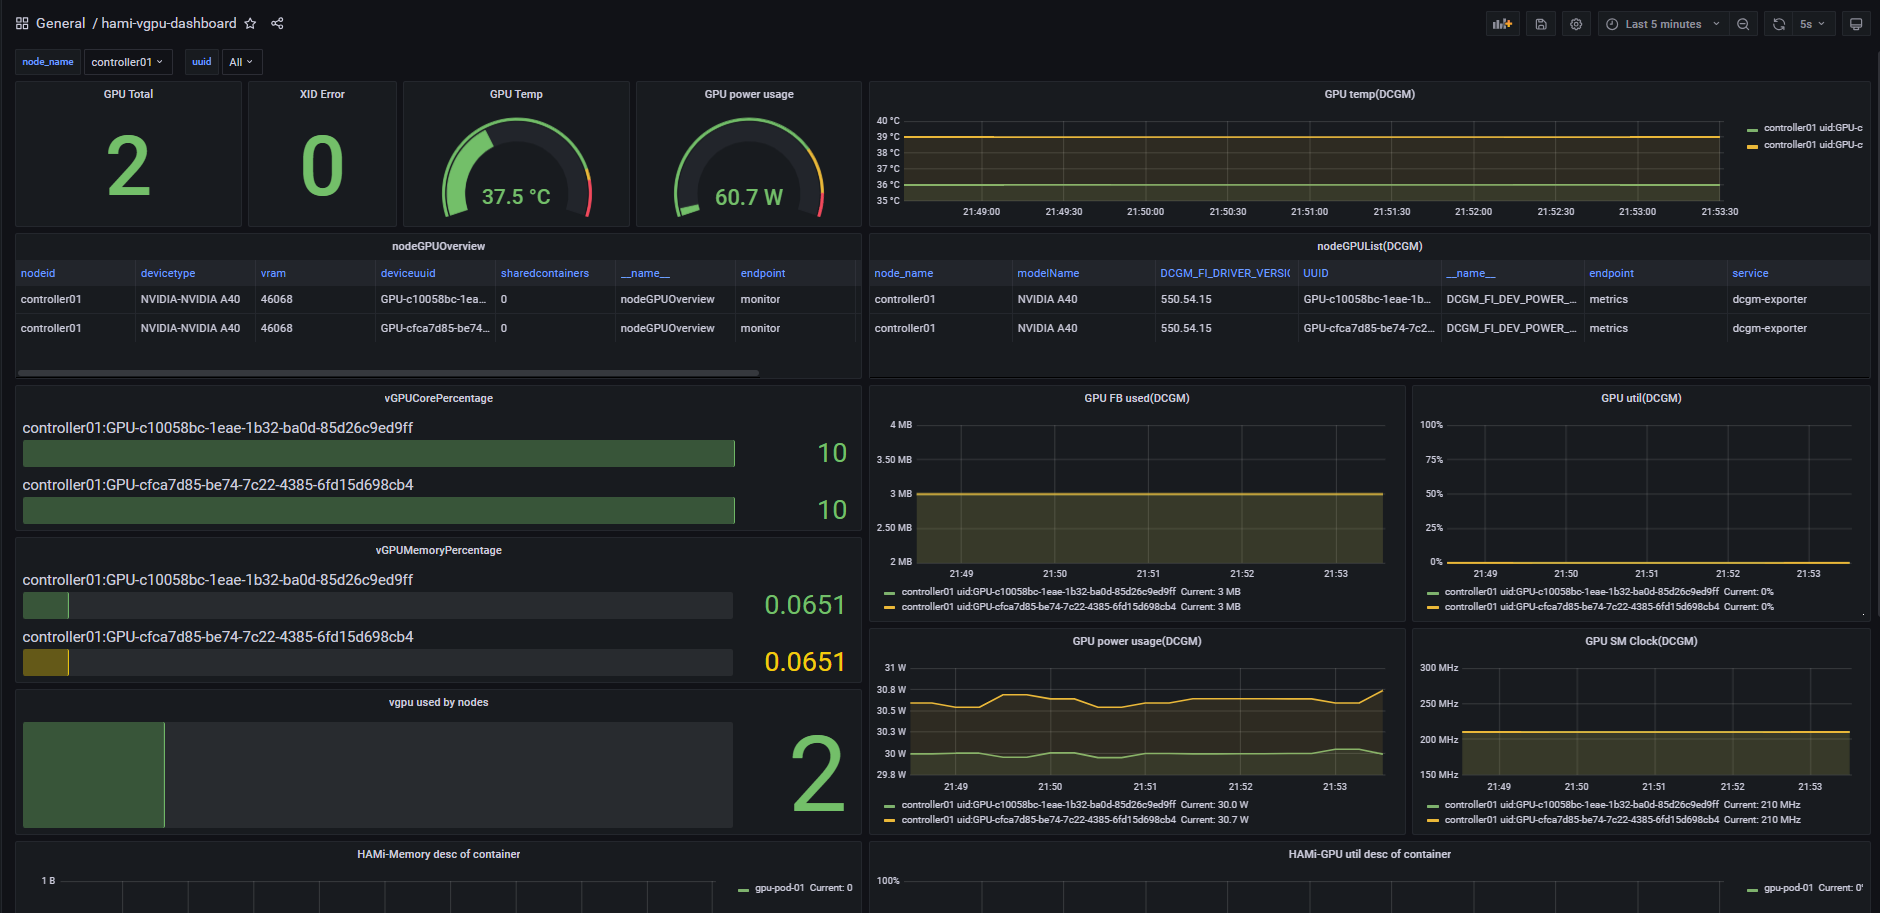
| You can see the monitoring details in the dashboard. The contents are as follows: | ||
|
|
||
|  |
There was a problem hiding this comment.
Choose a reason for hiding this comment
The reason will be displayed to describe this comment to others. Learn more.
It is best to place the referenced images in the ../imgs/
There was a problem hiding this comment.
Choose a reason for hiding this comment
The reason will be displayed to describe this comment to others. Learn more.
ok, changes has been made.
…he image display problem in document and document format

Signed-off-by: jiangsanyin <[email protected]>
|
@jiangsanyin This relabeling should be consistent with the configurations for It would be helpful to include this information in the documentation, as users unfamiliar with the Prometheus stack may struggle to configure everything correctly on the first attempt |
Have you created and applied the ServiceMonitor as depicted in dashboard.md or dashboard_cn.md?node_name is added after this is done.
#apply the file hami-device-plugin-svc-monitor.yaml |
|
@jiangsanyin It’s important to document this configuration to ensure it aligns with the relabeling setup for |
Signed-off-by: jiangsanyin [email protected]
What type of PR is this?
/kind bug
What this PR does / why we need it:
fix grafana dashboard and clarify dashboard usage more clearly. Thanks "fangfenghuang (https://github.com/fangfenghuang)" for your help
Which issue(s) this PR fixes:
Fixes #498 #468
Special notes for your reviewer:
Does this PR introduce a user-facing change?: