English | 简体中文
Project introduction:http://gophertok.kuaji.club/
Project presentation:https://www.bilibili.com/video/BV1sh4y1N7bq/?spm_id_from=333.999.0.0
 |
The sixth Bytedance Youth training camp big project works, a simple version of Tiktok project ,built with go-zero microservice . Completed by the gopher team |
|---|
| Feature | Implementation |
|---|---|
| HTTP framework | go-zero |
| RPC framework | go-zero |
| ORM framework | gorm |
| Database | Innodb-cluster,redis-cluster,mongodb |
| Object storage | Tencent Cloud COS, Minio |
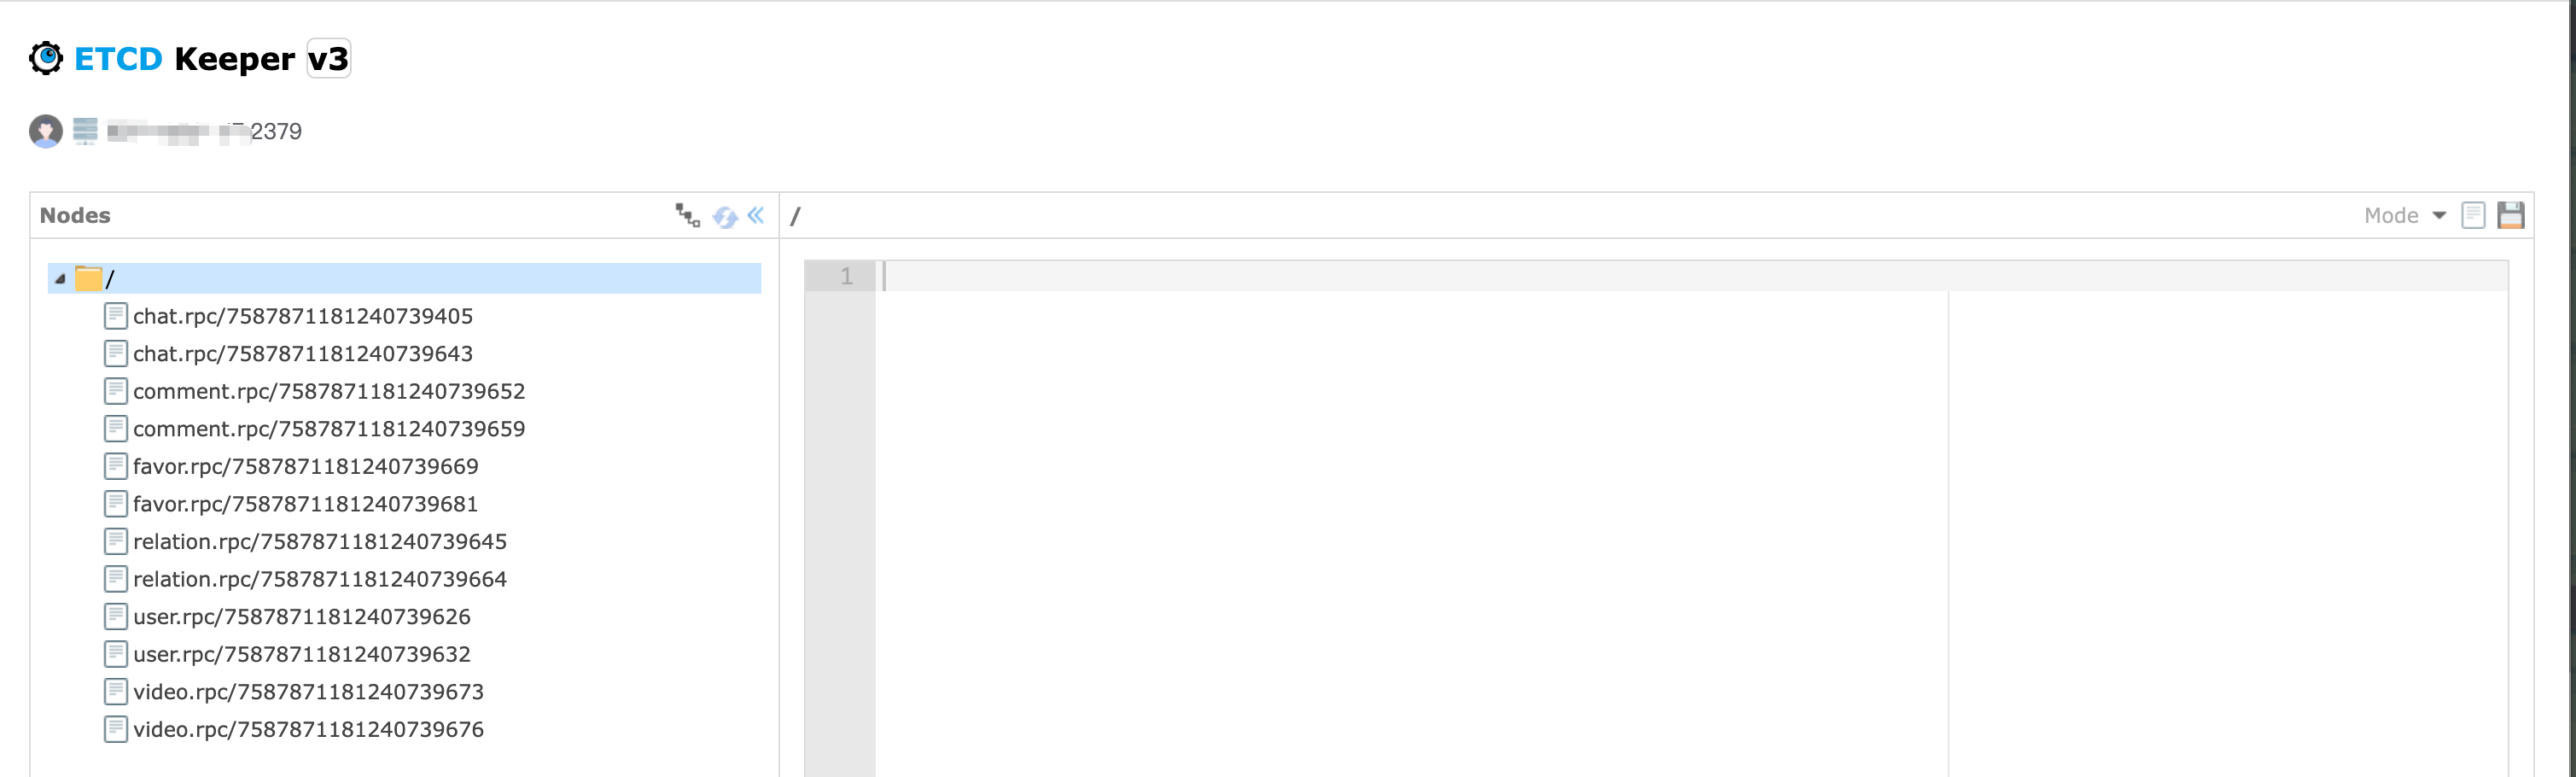
| Service discovery, registration, and configuration center | etcd,nacos |
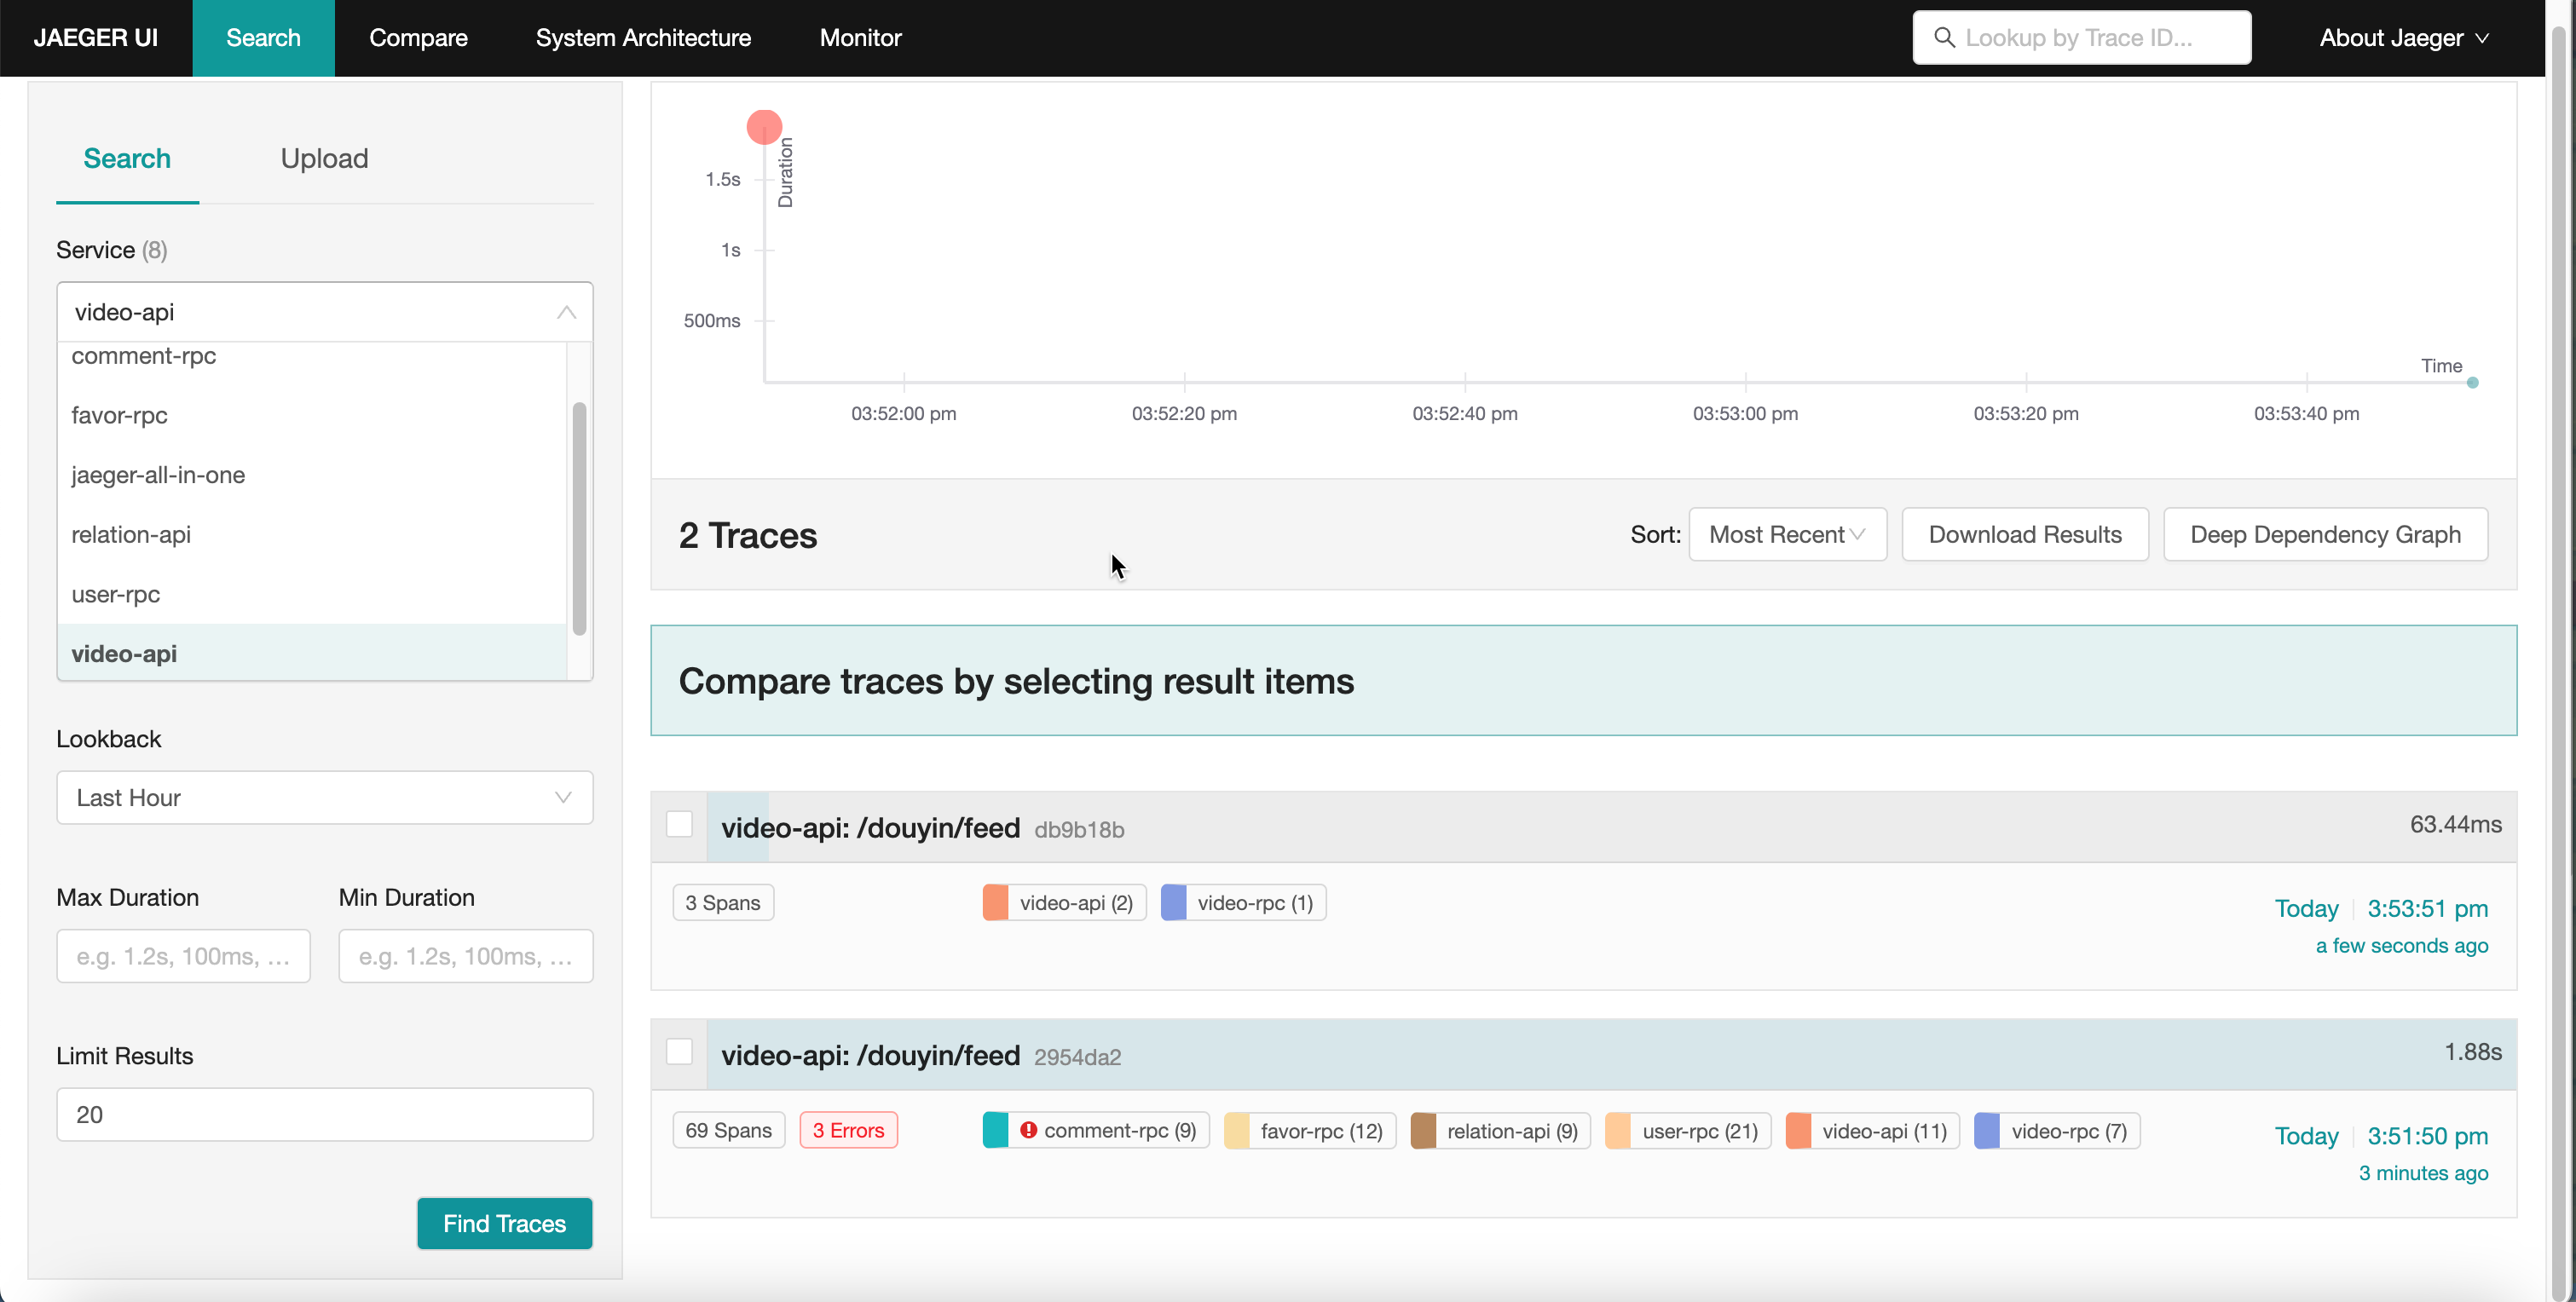
| Tracing | jaeger |
| Service monitoring | prometheus,grafana |
| Message queue | kafka |
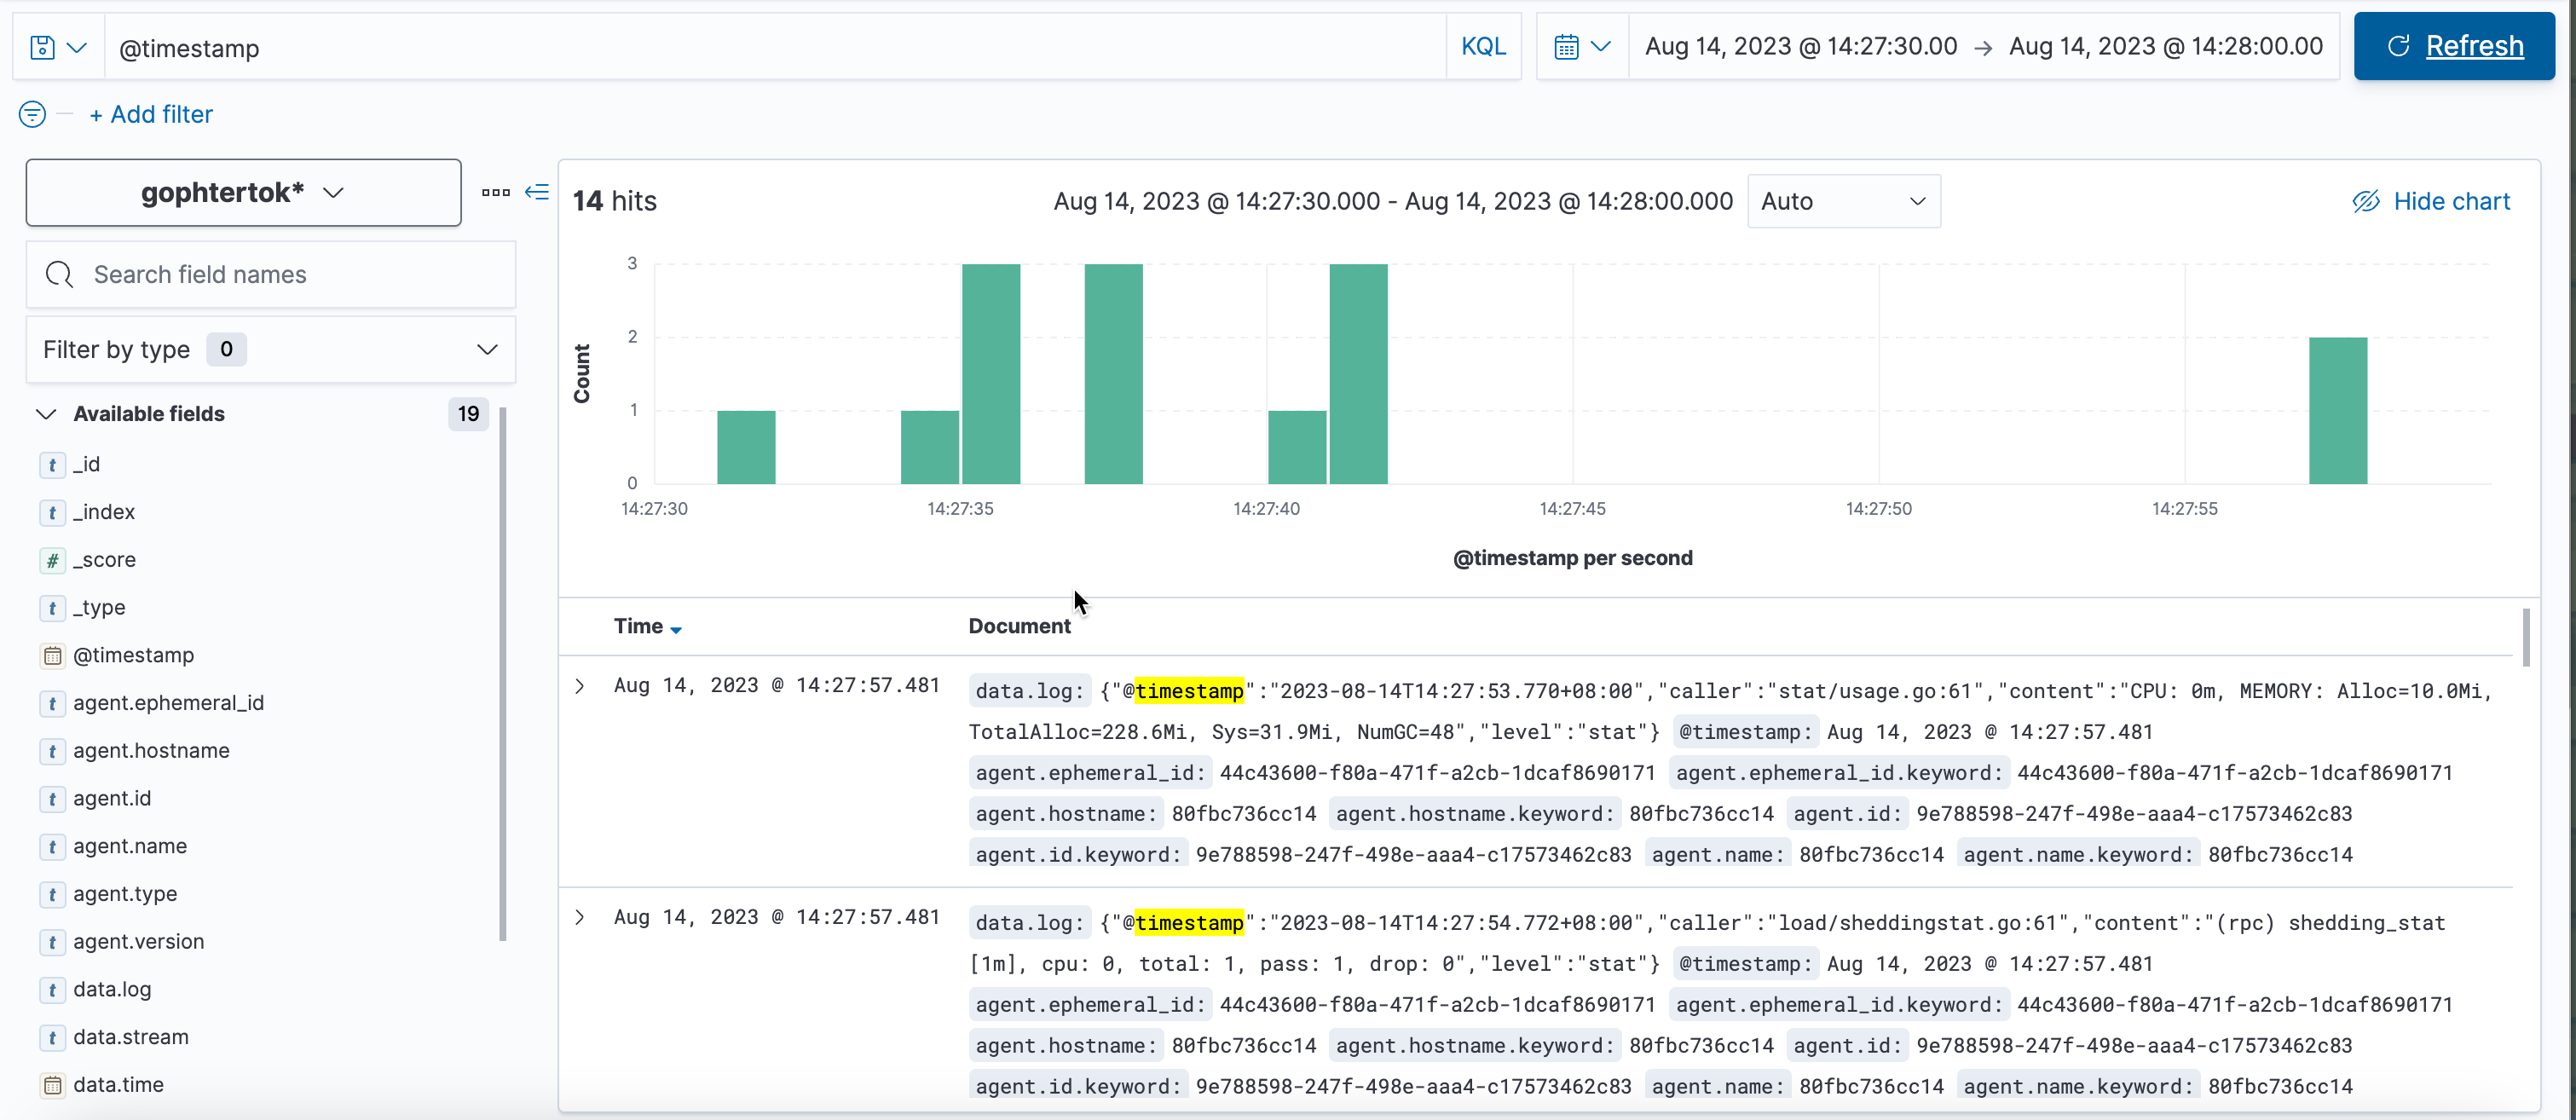
| Log collection | filebeat,go-stash,elasticsearch,kibana |
| Gateway | traefik |
| Deployment | Docker,docker-compose |
| CI/CD | Github Action |
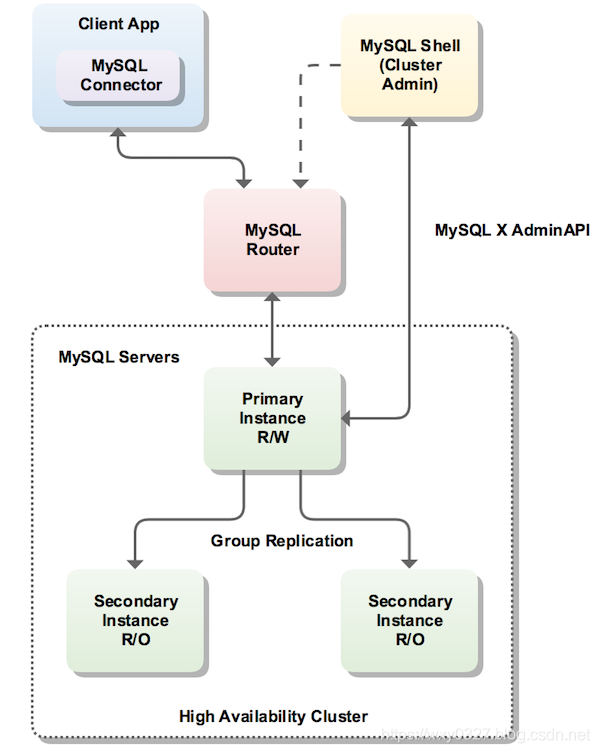
innodb-cluster
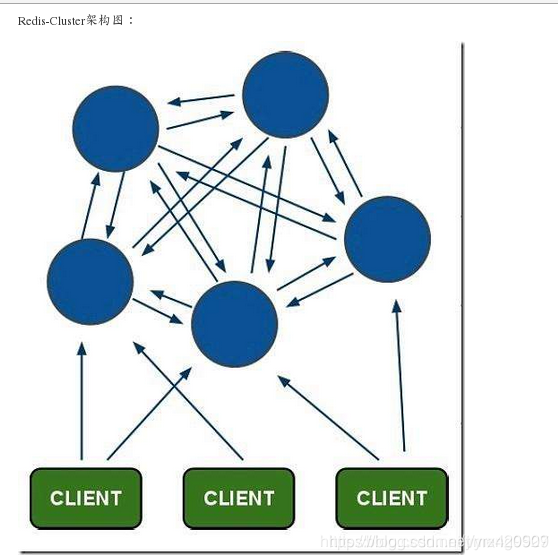
redis-cluster
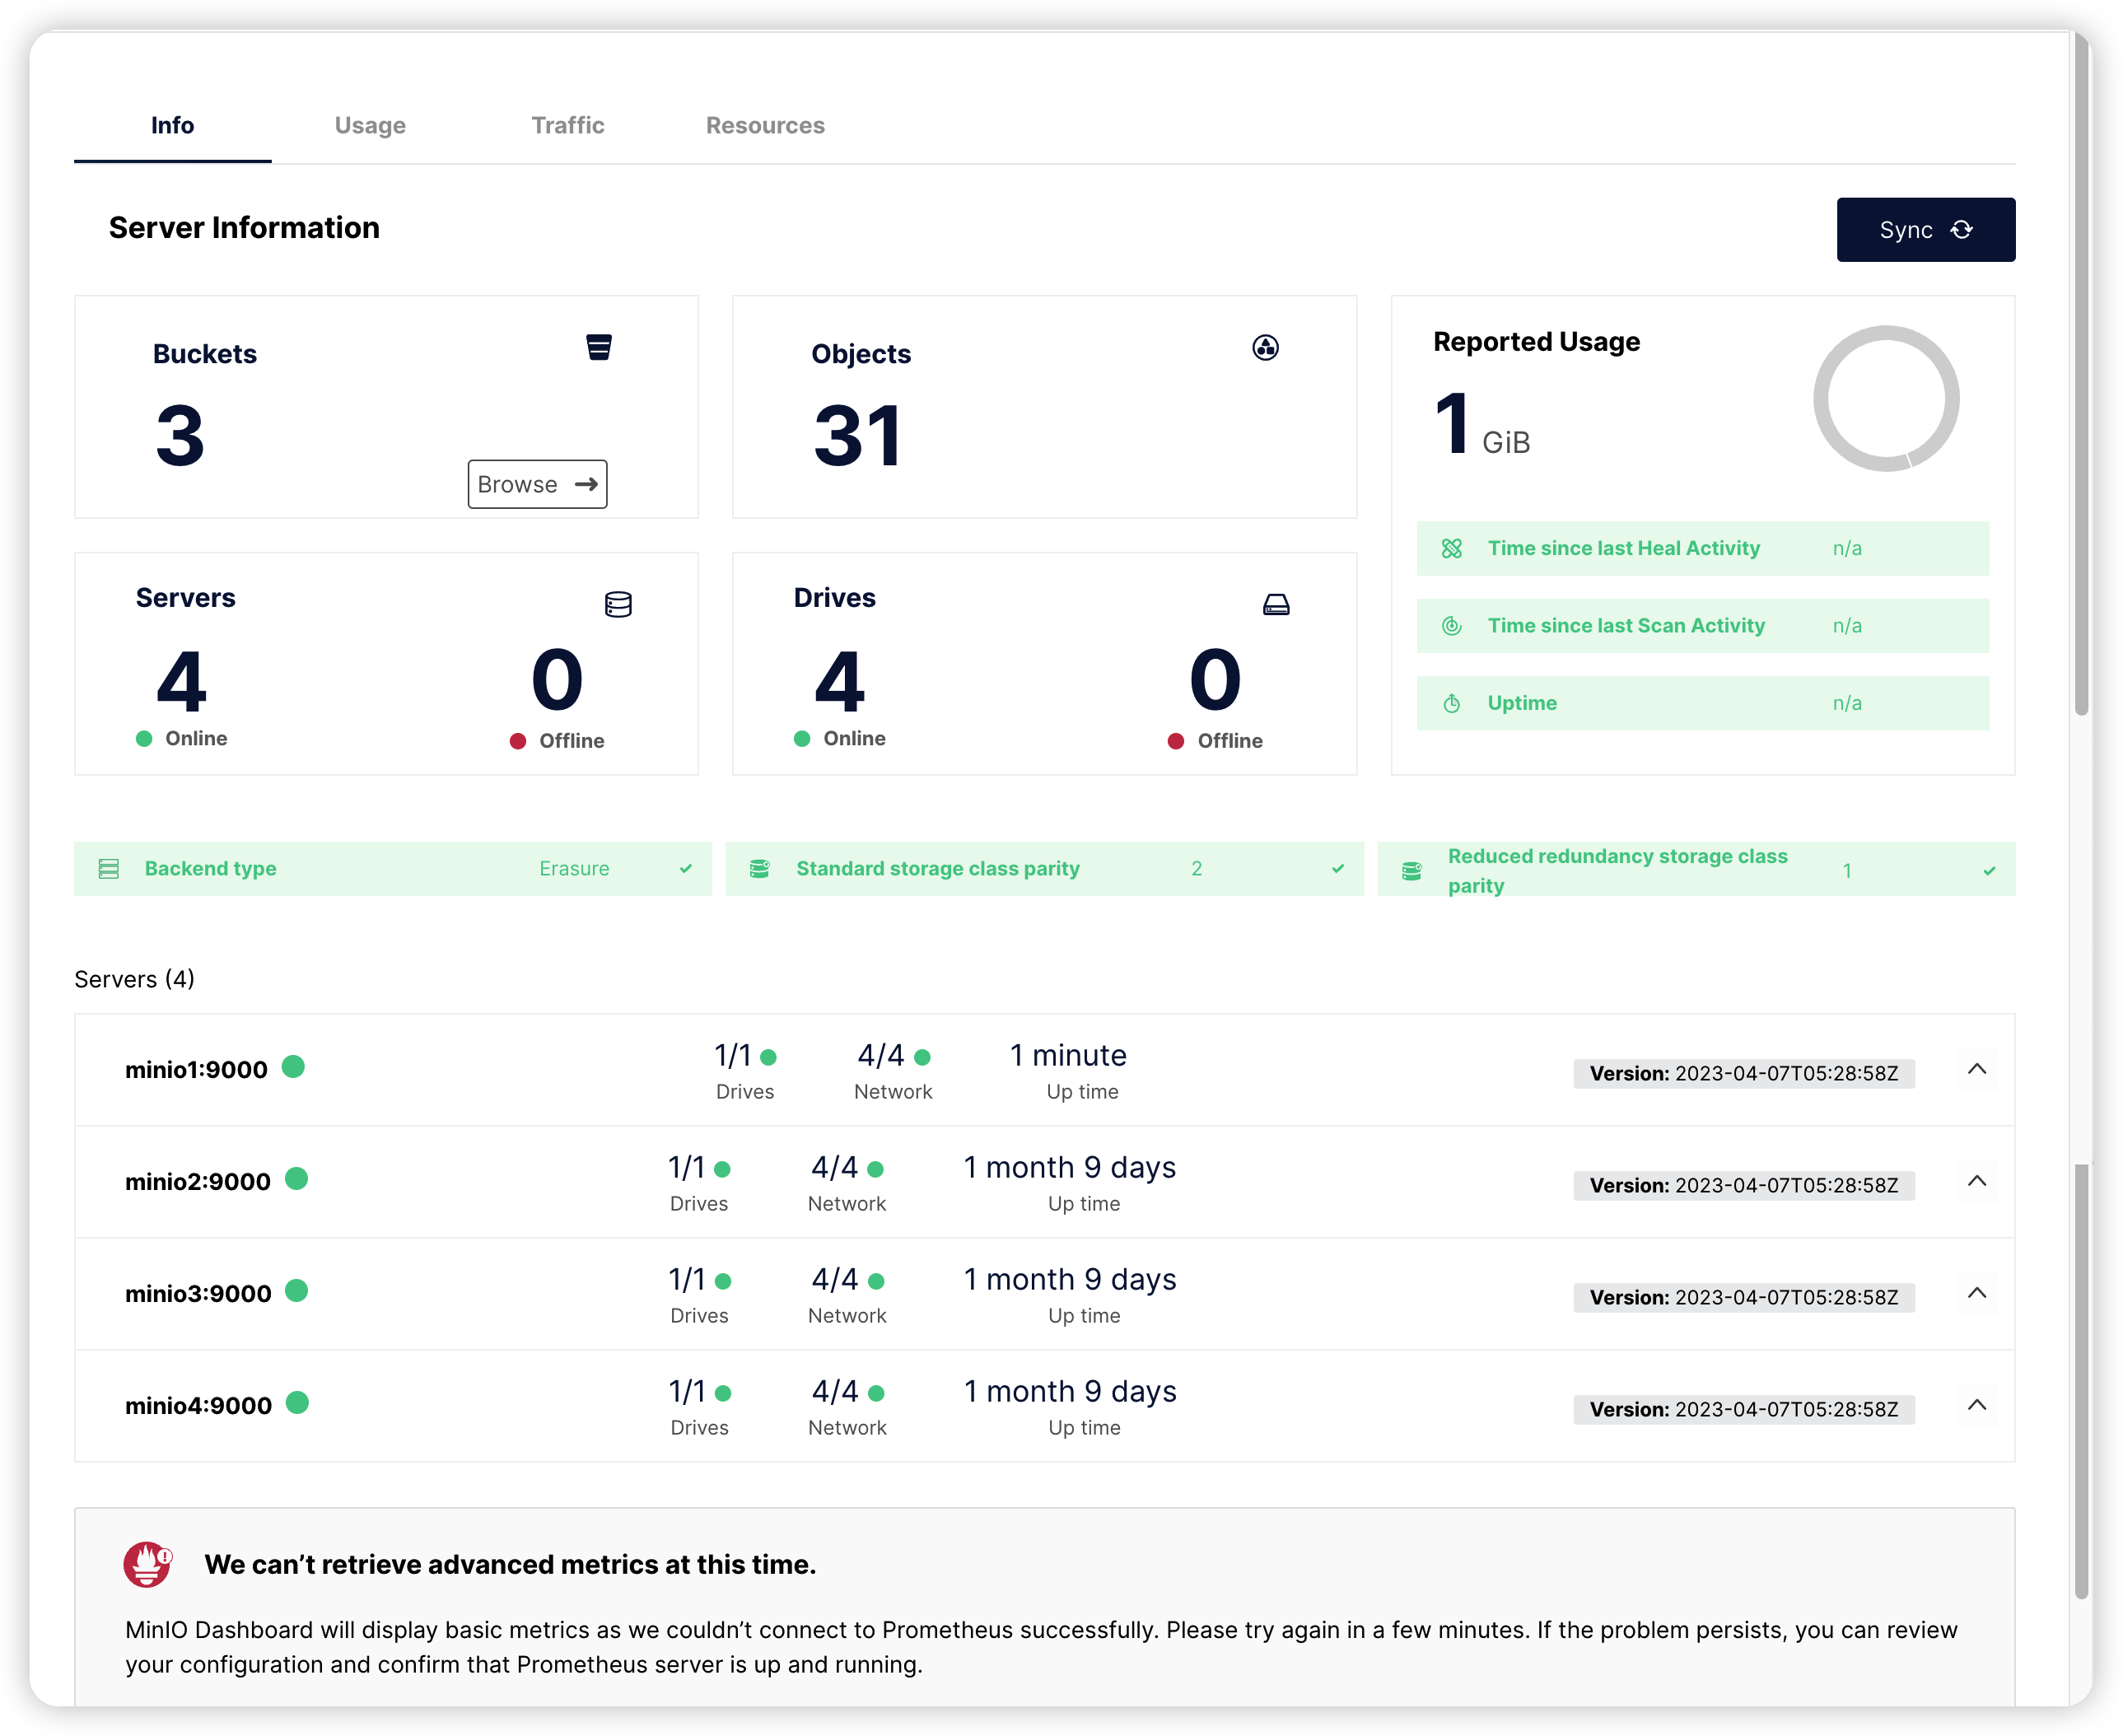
minio cluster
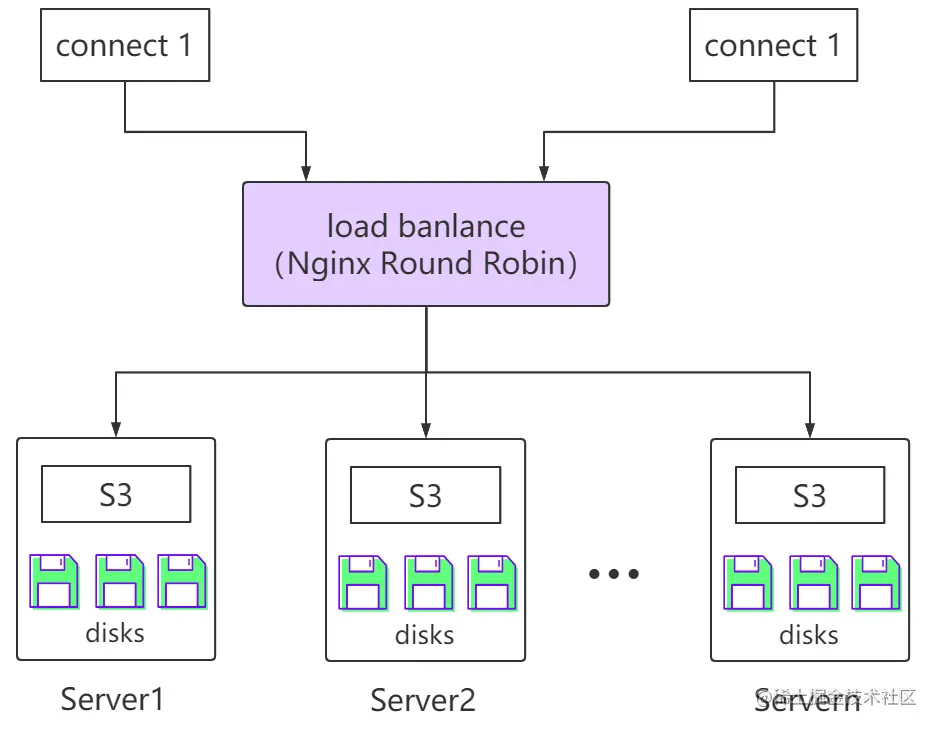
- 4 nodes
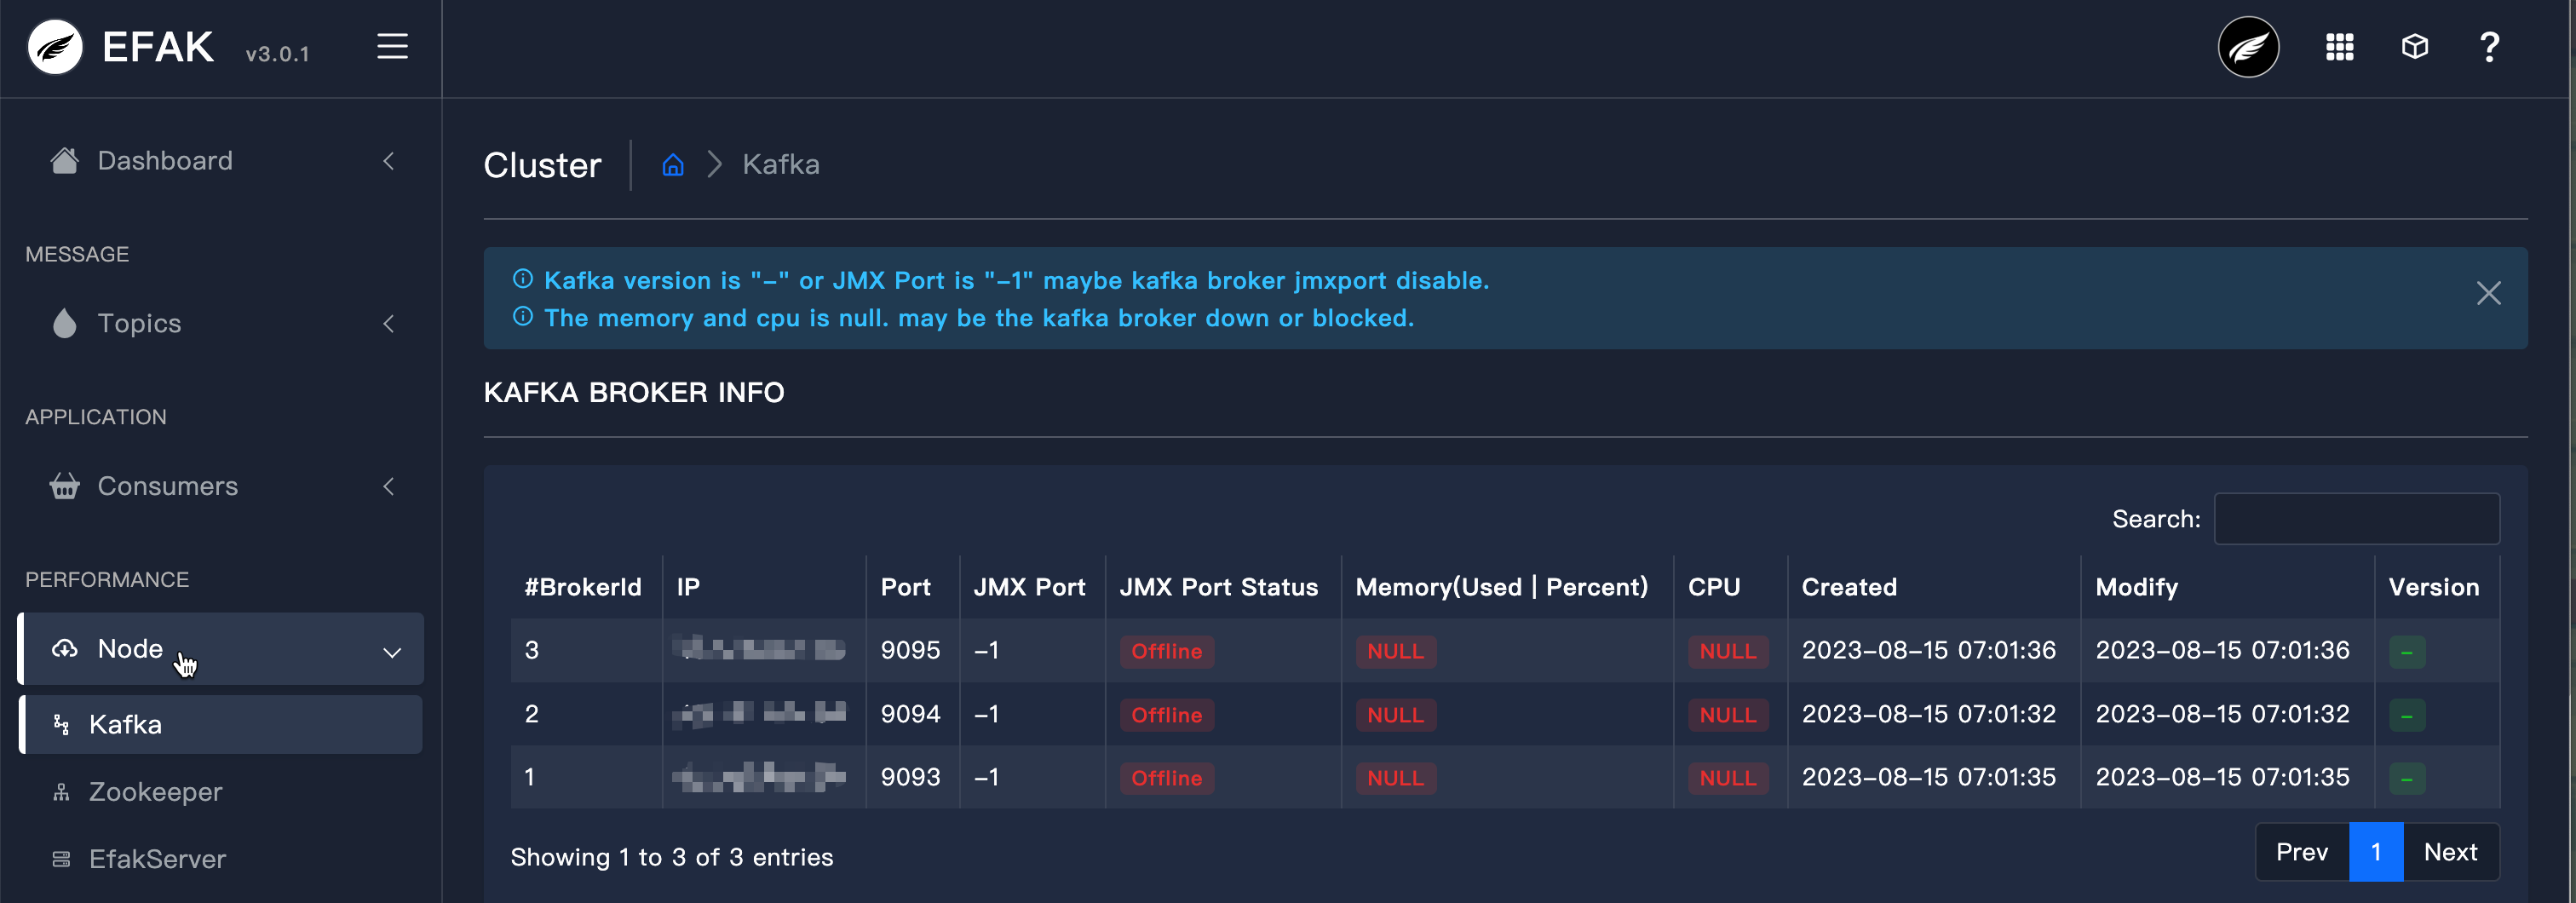
kafka cluster
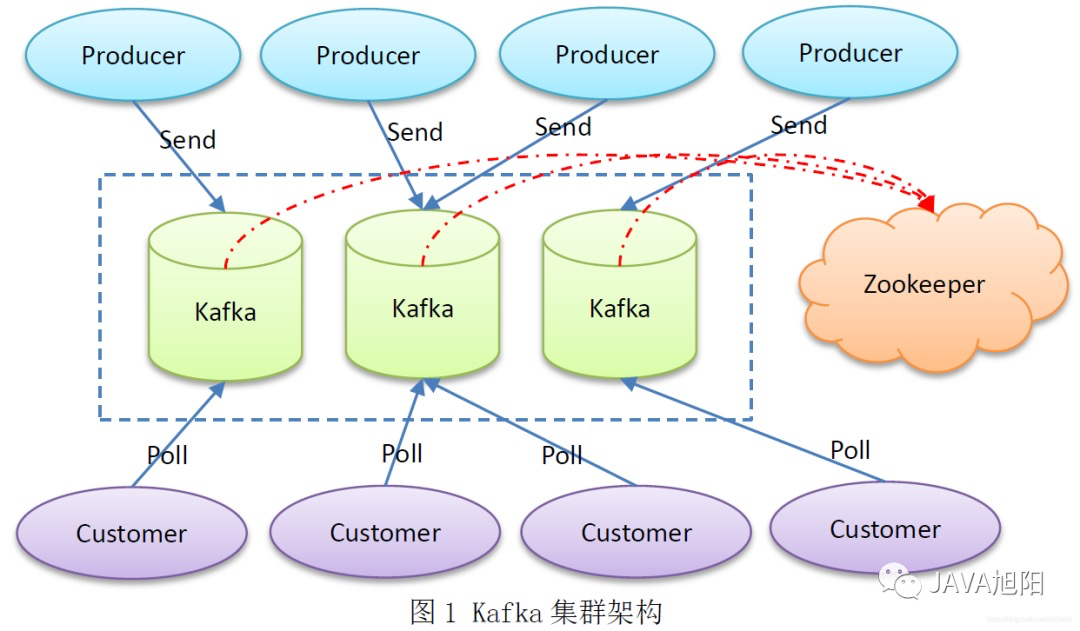
- 3rd node
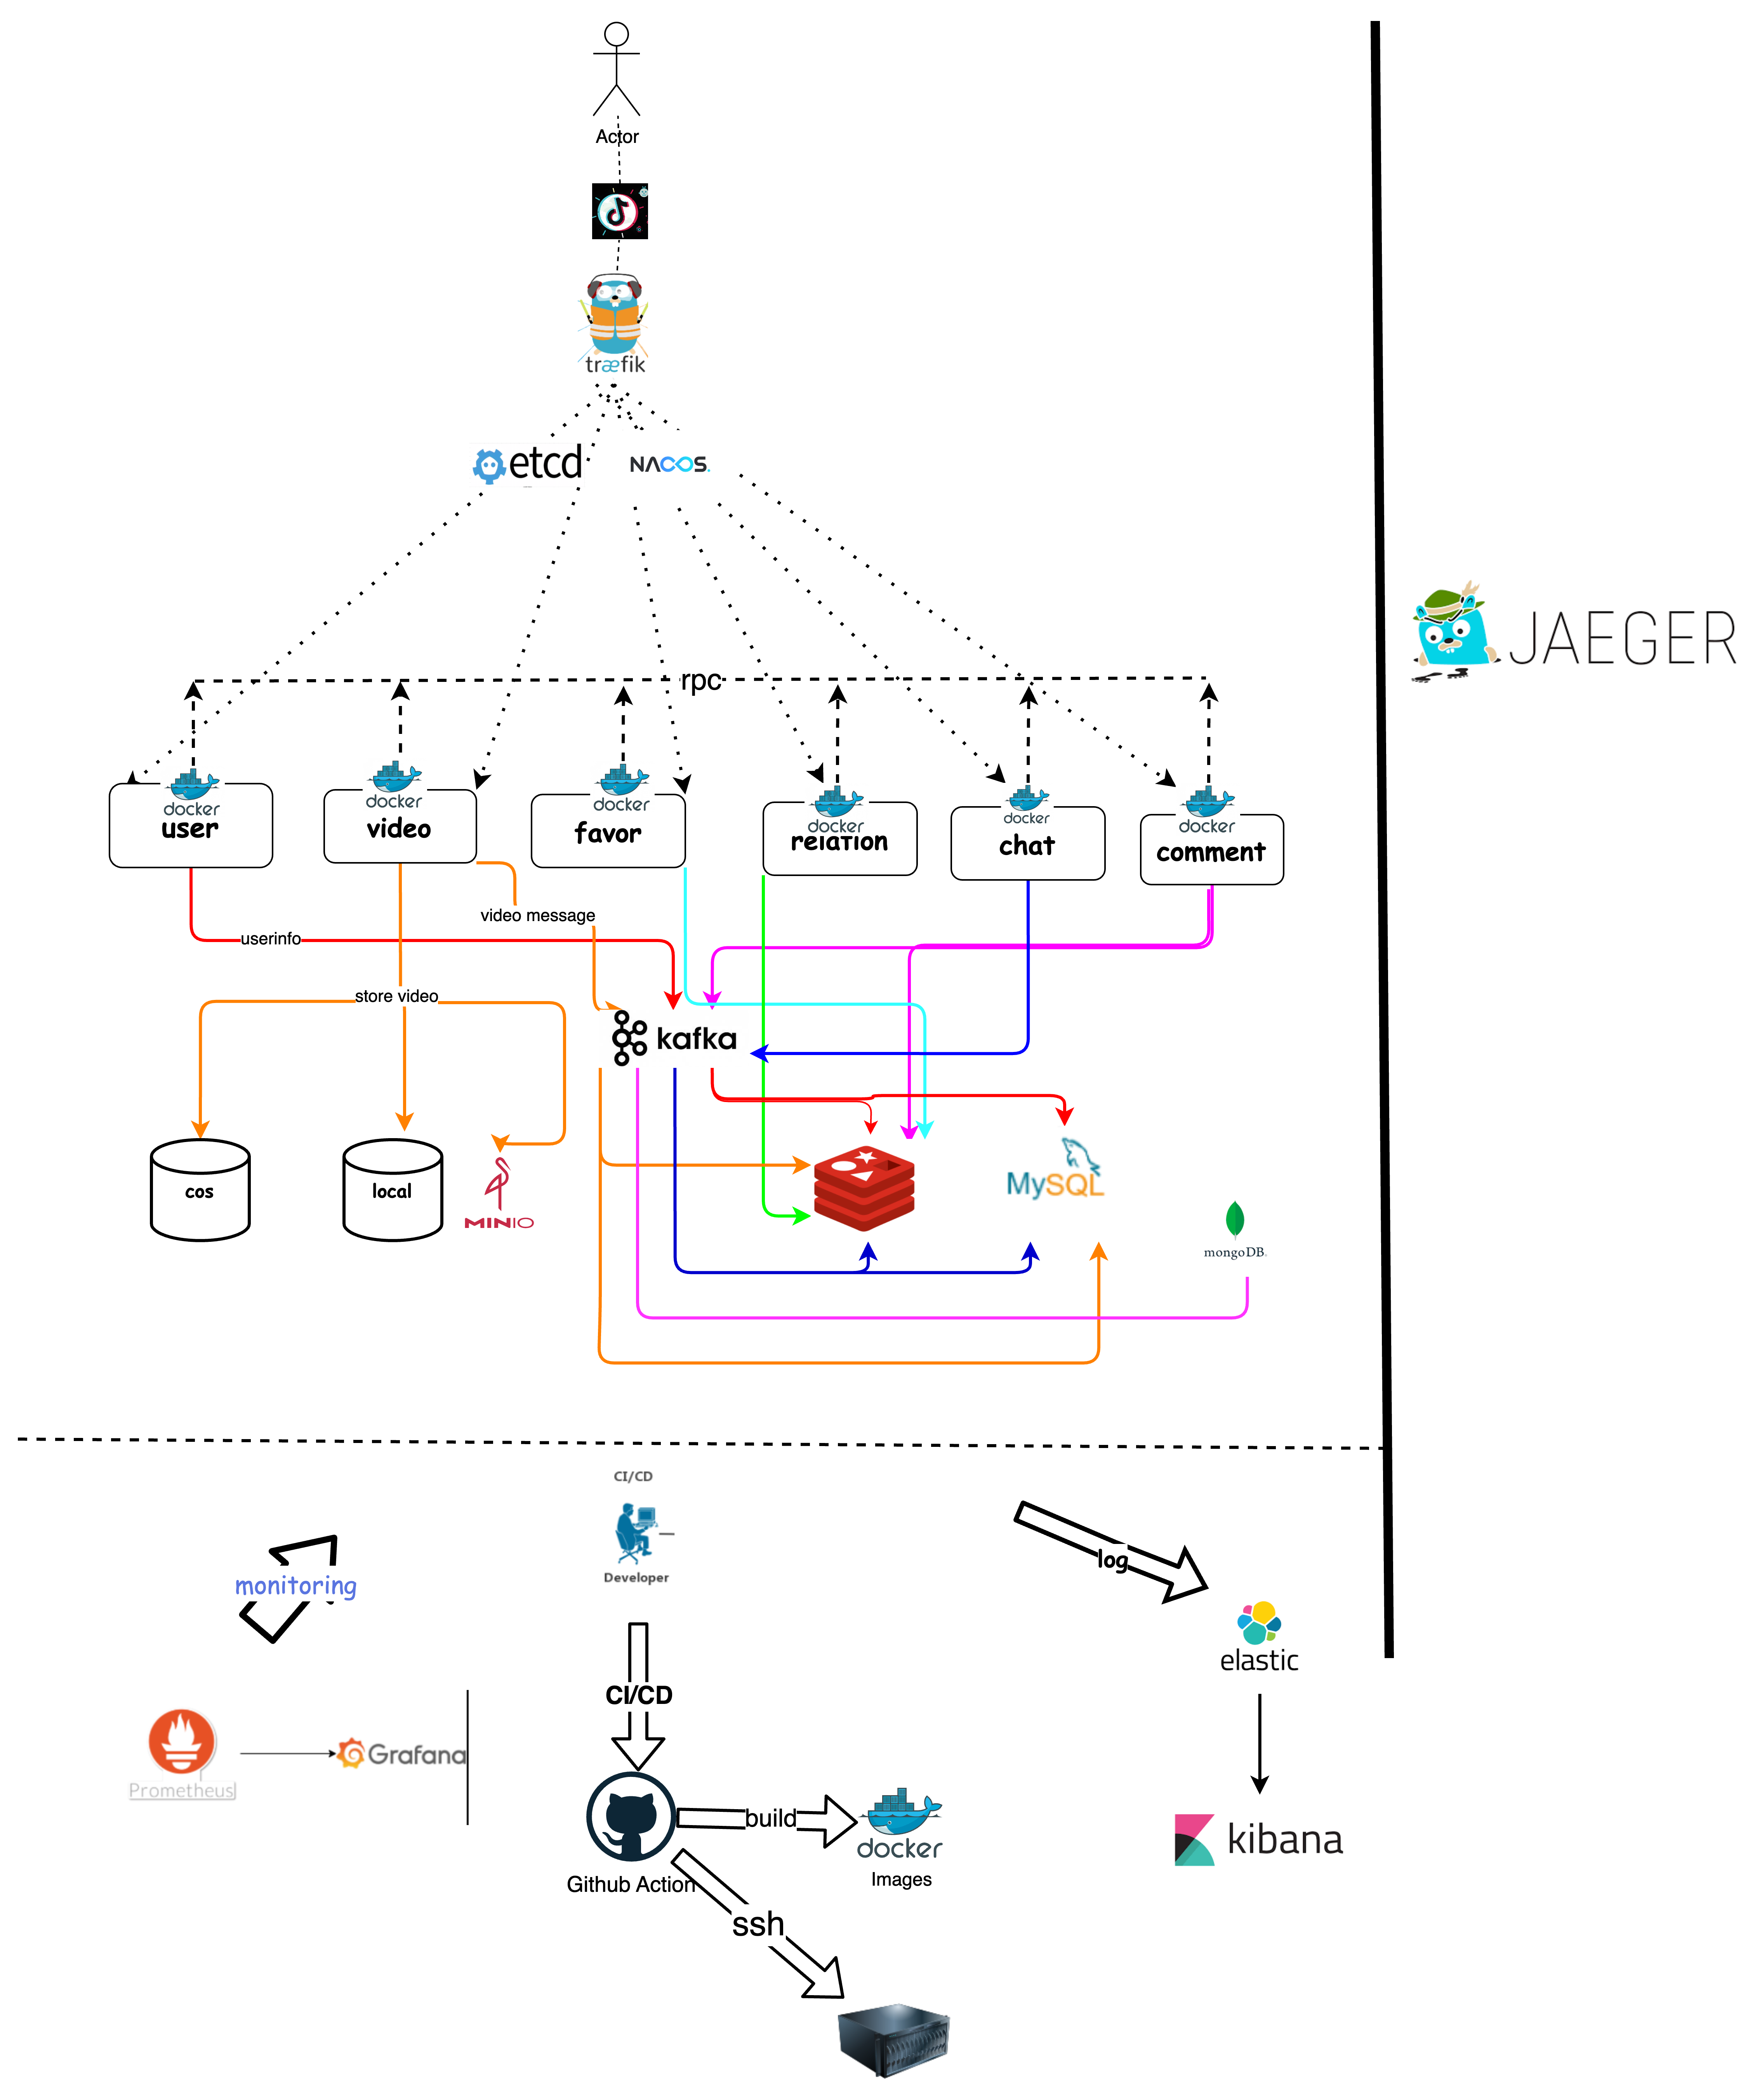
- The APIs and RPCs of the services start multiple docker instances. Traefik is used to load balance the APIs, and the RPCs implement load balancing via etcd to ensure service reliability and easy scalability during peak periods.
The RPC calls of each service are executed concurrently, significantly reducing response time. Redis is used as a cache for high-frequency data, reducing the pressure on MySQL. Kafka is used to asynchronously write to MySQL, increasing system throughput.·
kafka uses clustered writes to greatly reduce disk io and network io
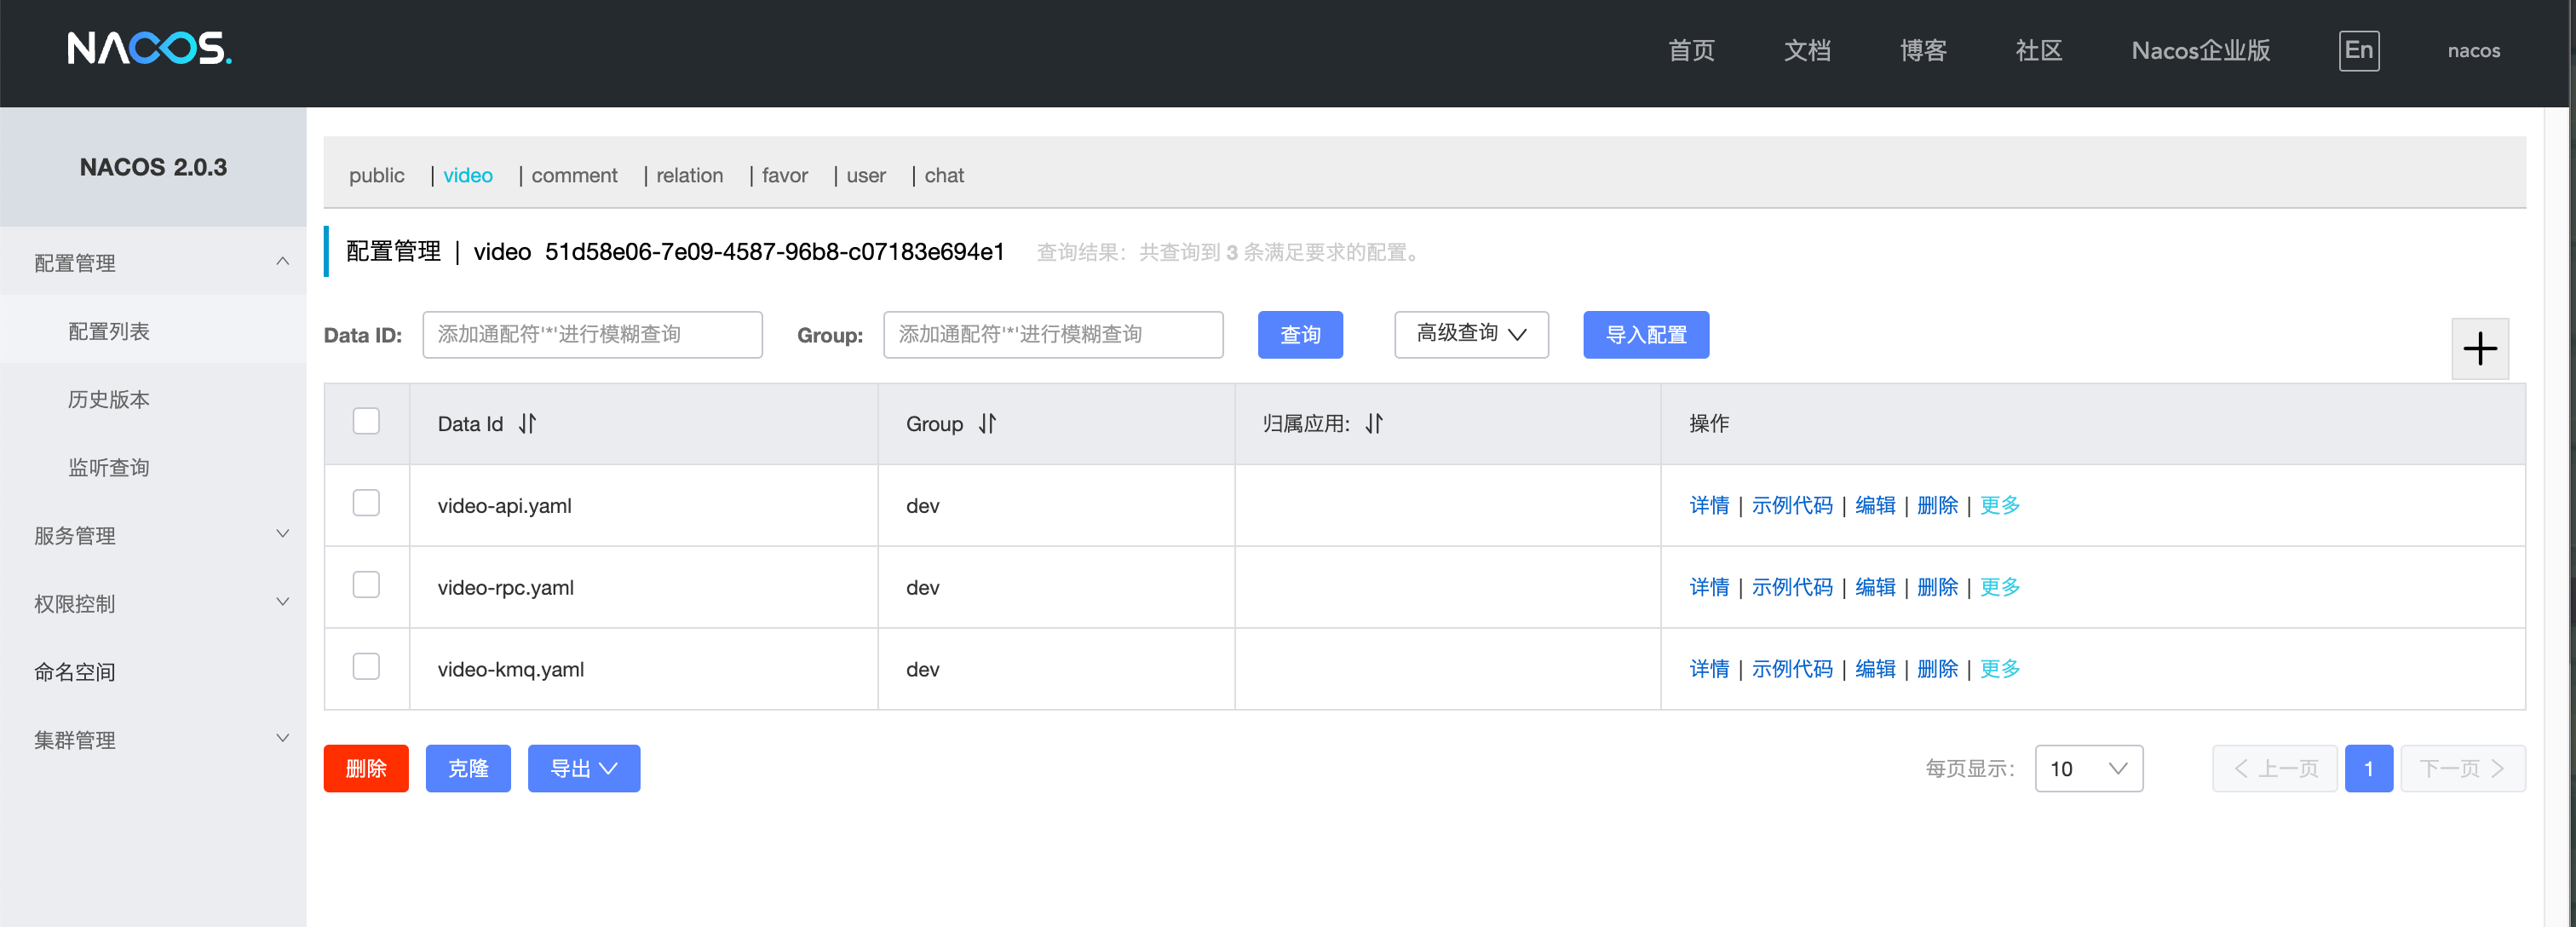
Nacos is used as the configuration center
Etcd is used for service discovery and registry
Jaeger is used for link tracing across services.
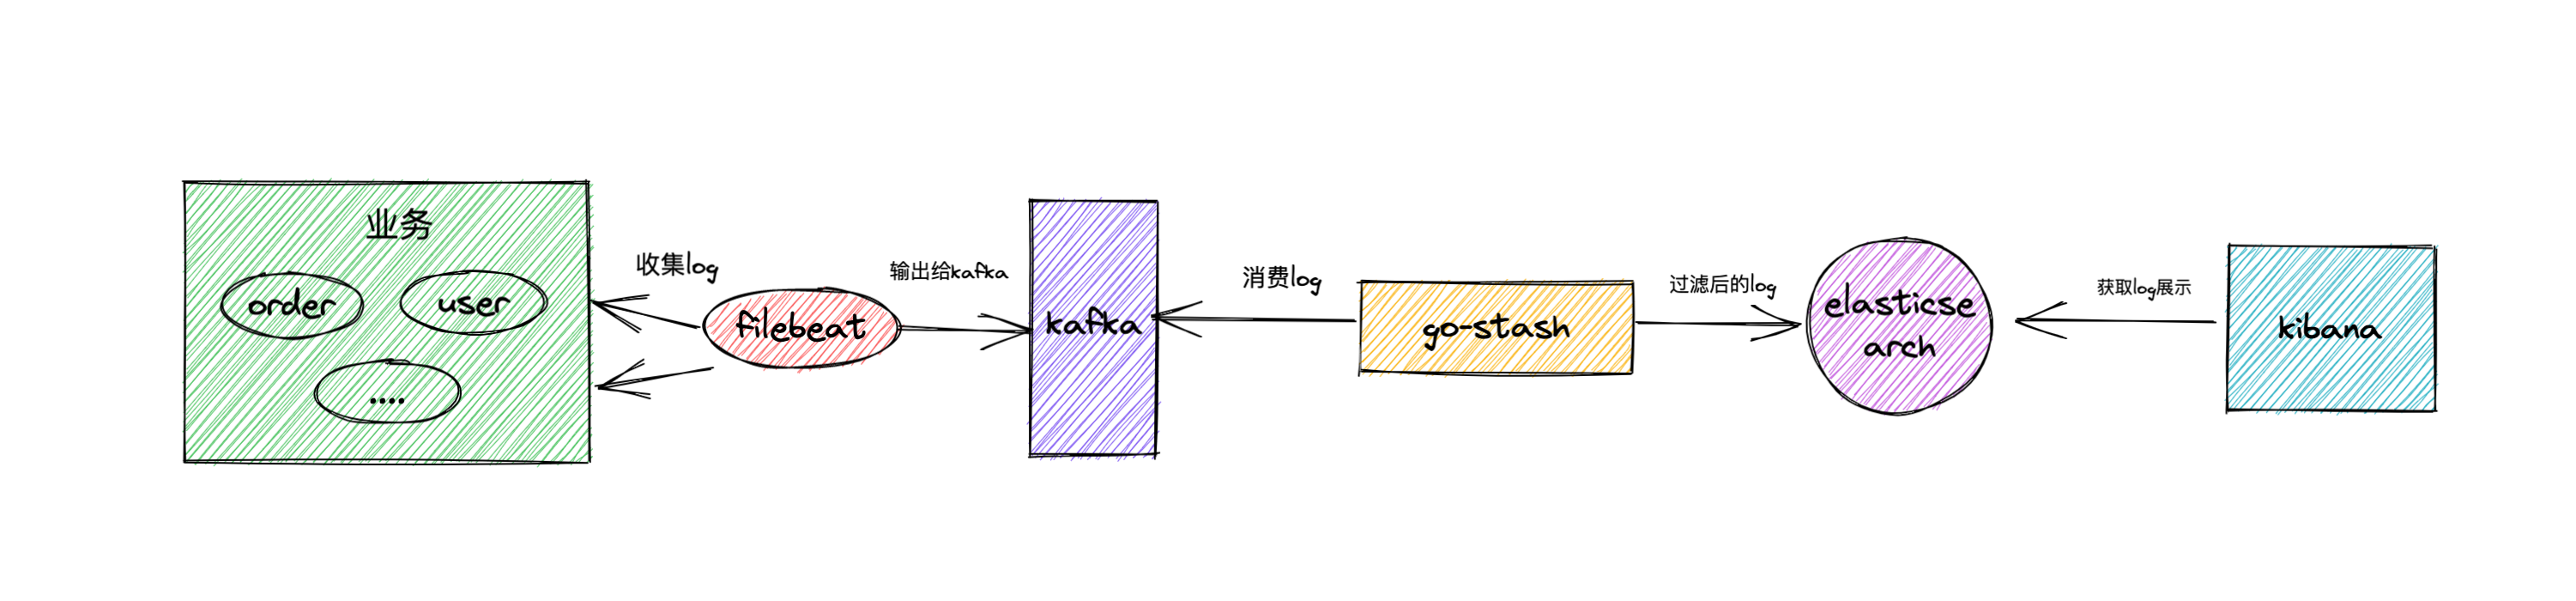
Filebeat collects logs and sends them to Kafka for buffering. Go-stash filters the logs based on configuration and outputs the filtered logs to Elasticsearch. Kibana is responsible for visualizing the logs.
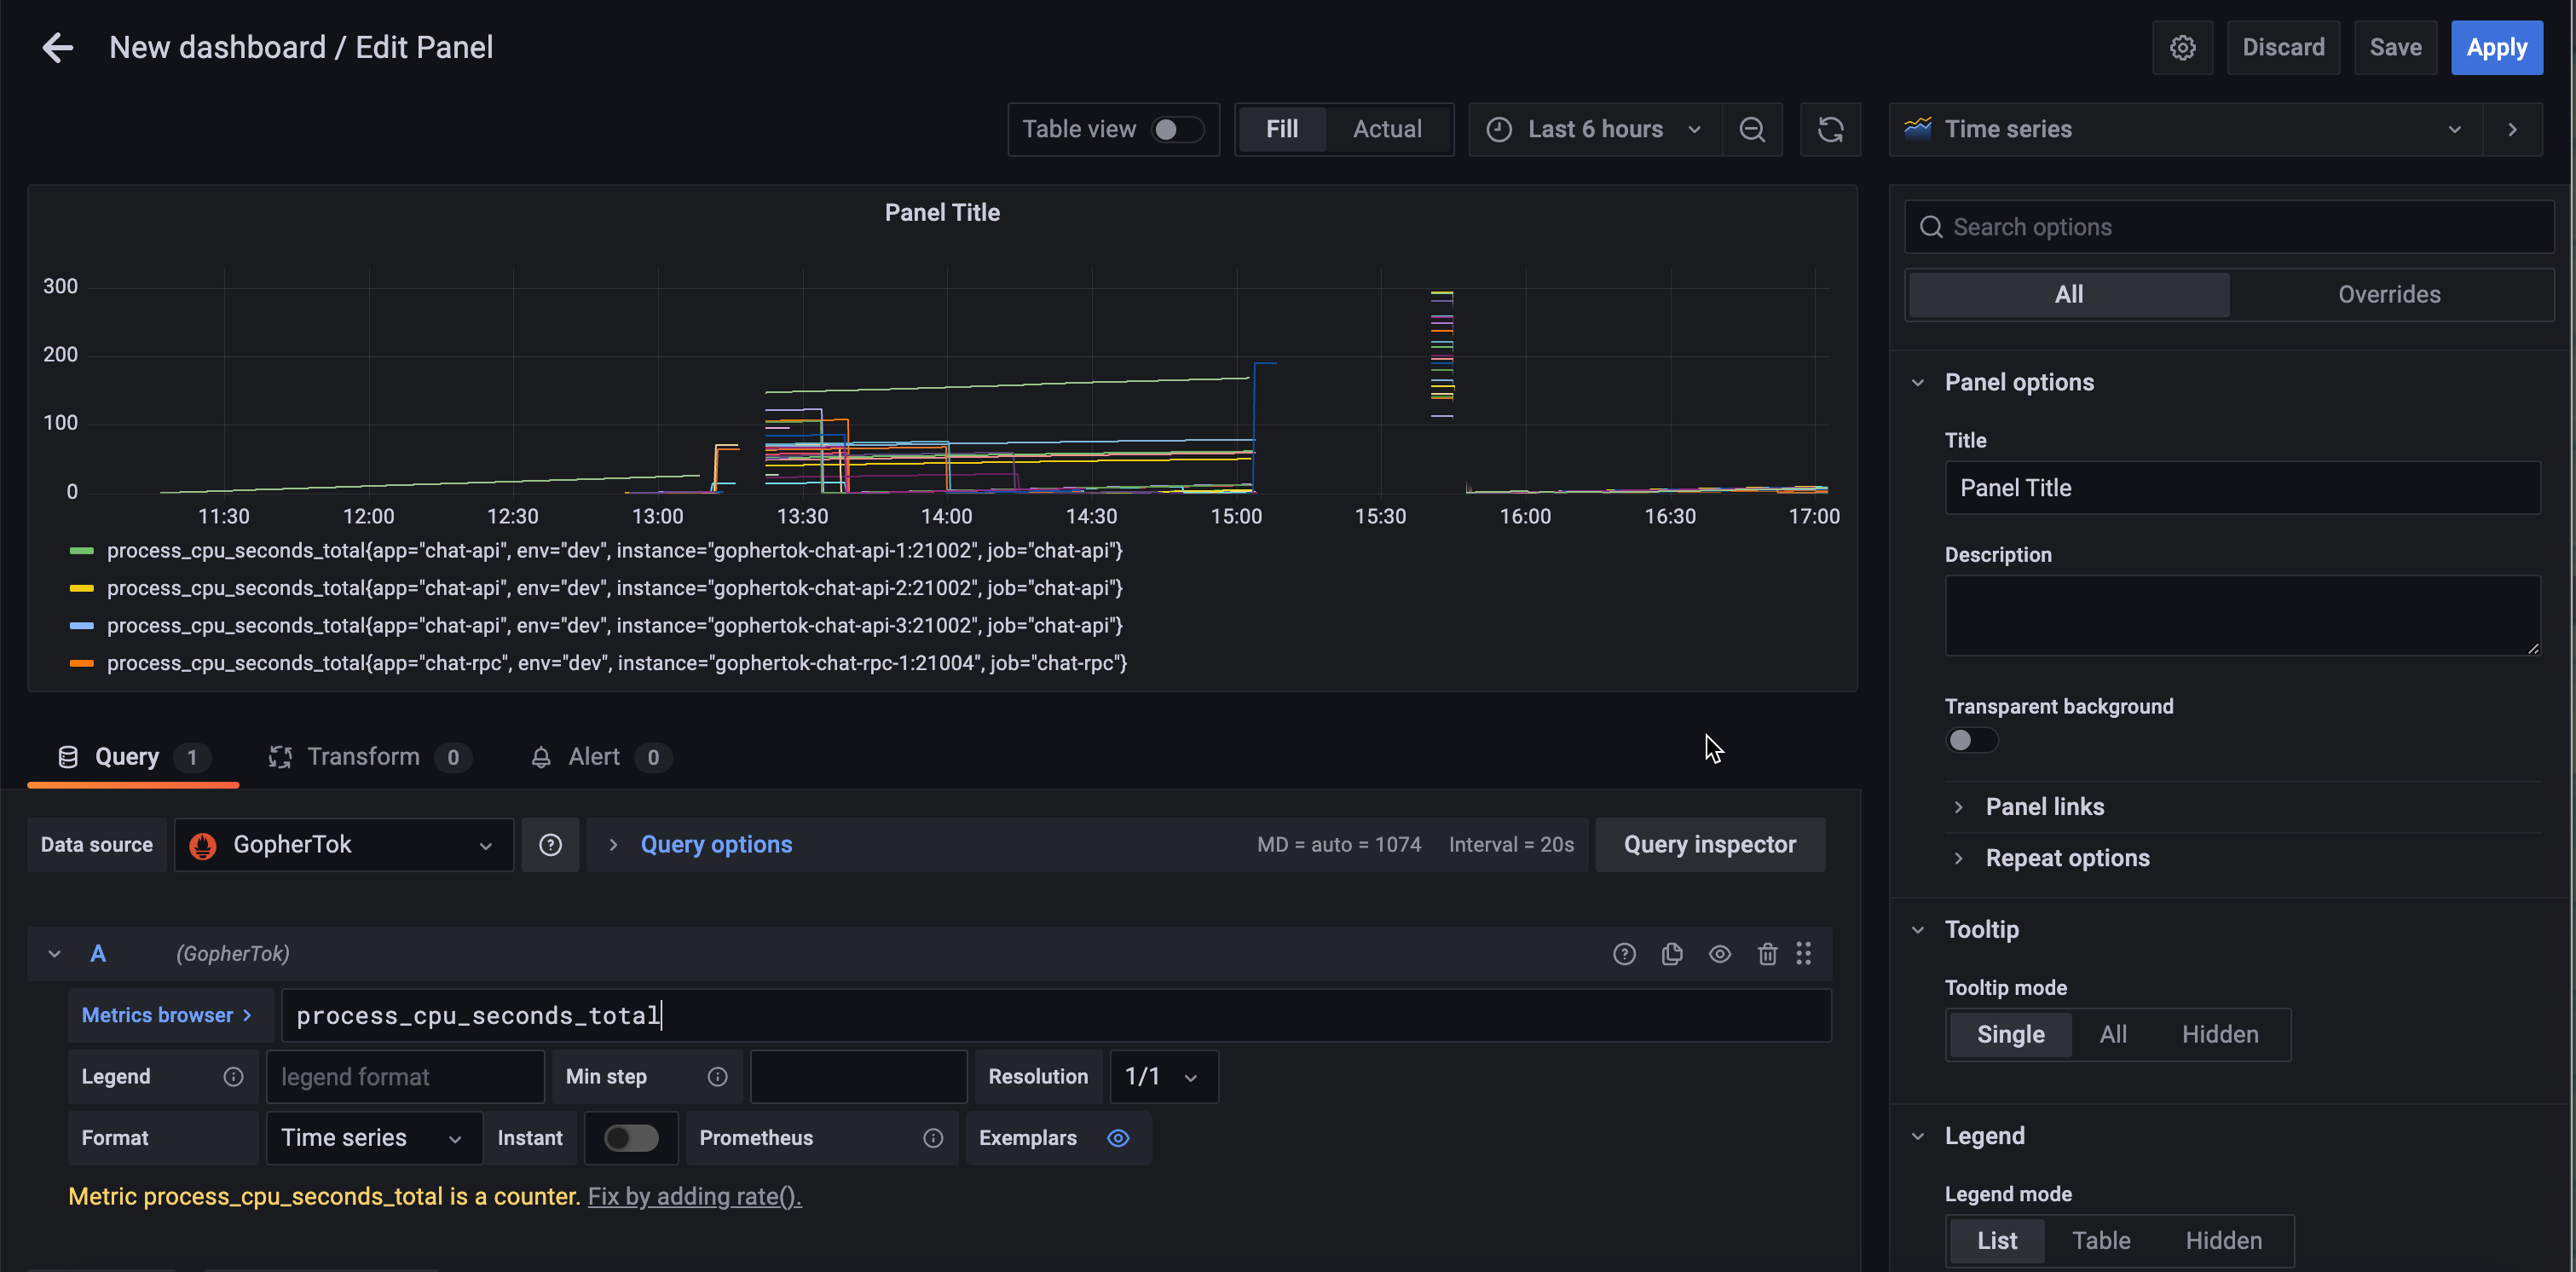
Prometheus is used for service monitoring, with Grafana providing a visualization interface.
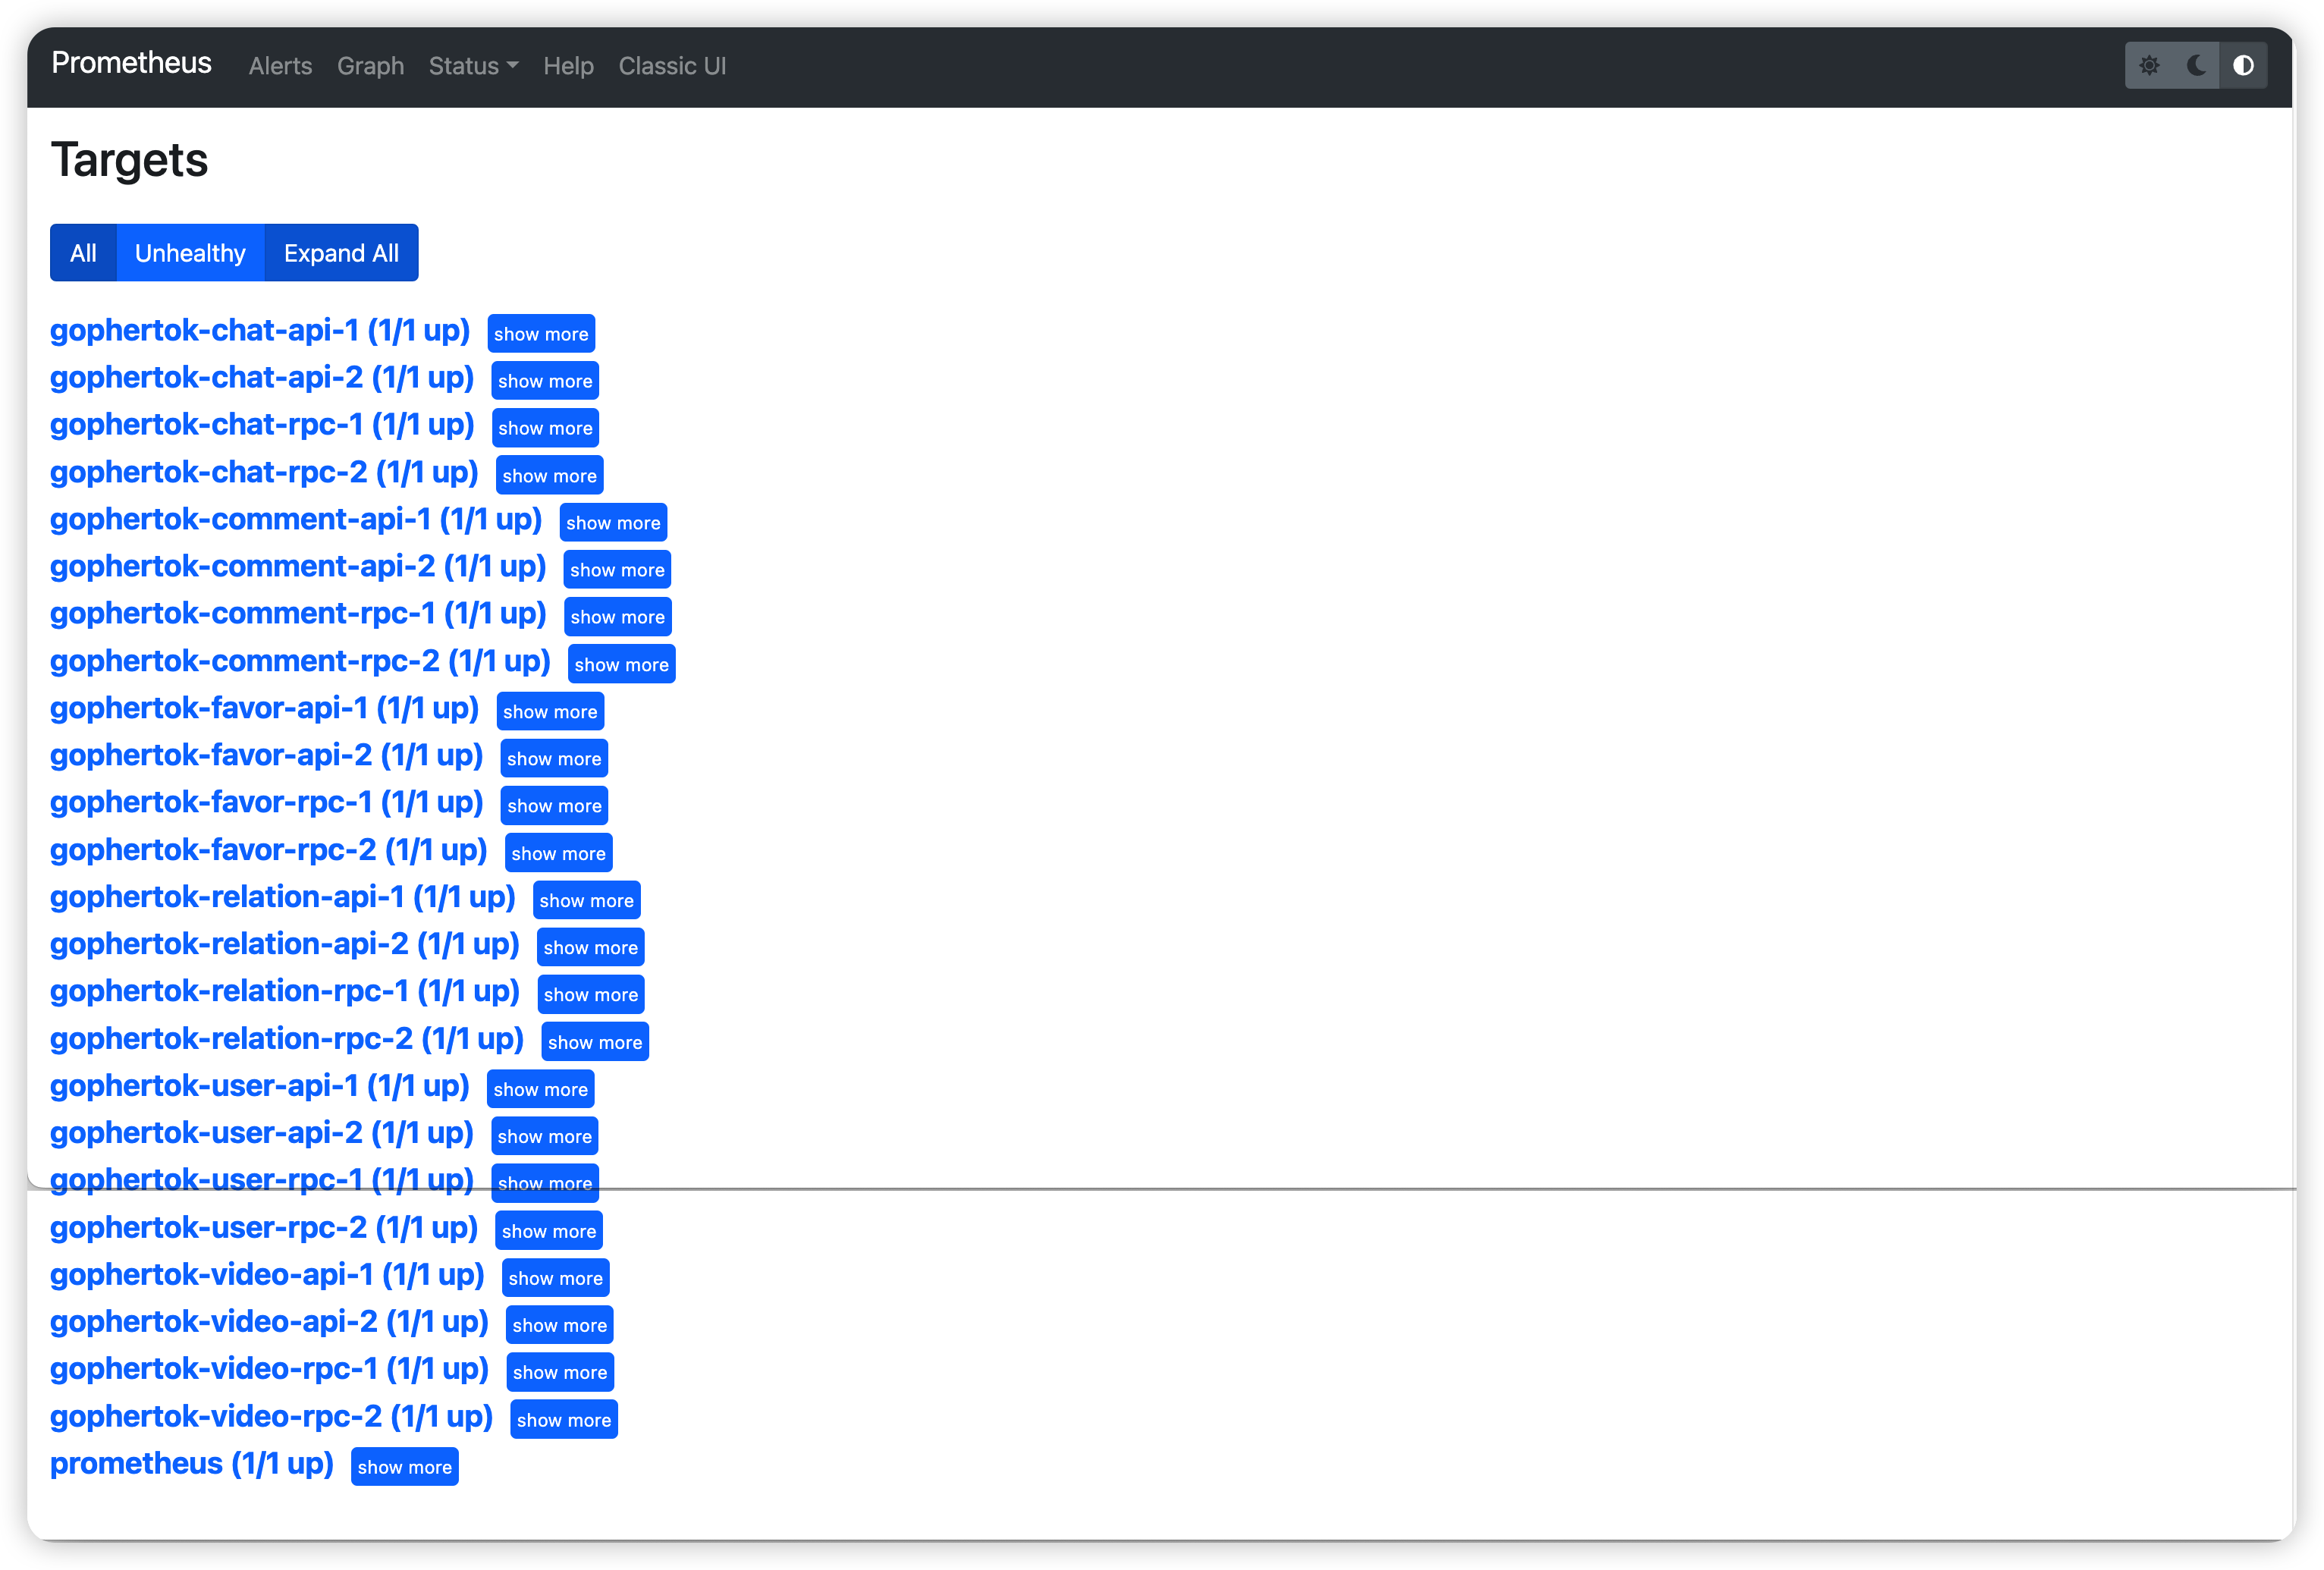
visualized by grafana
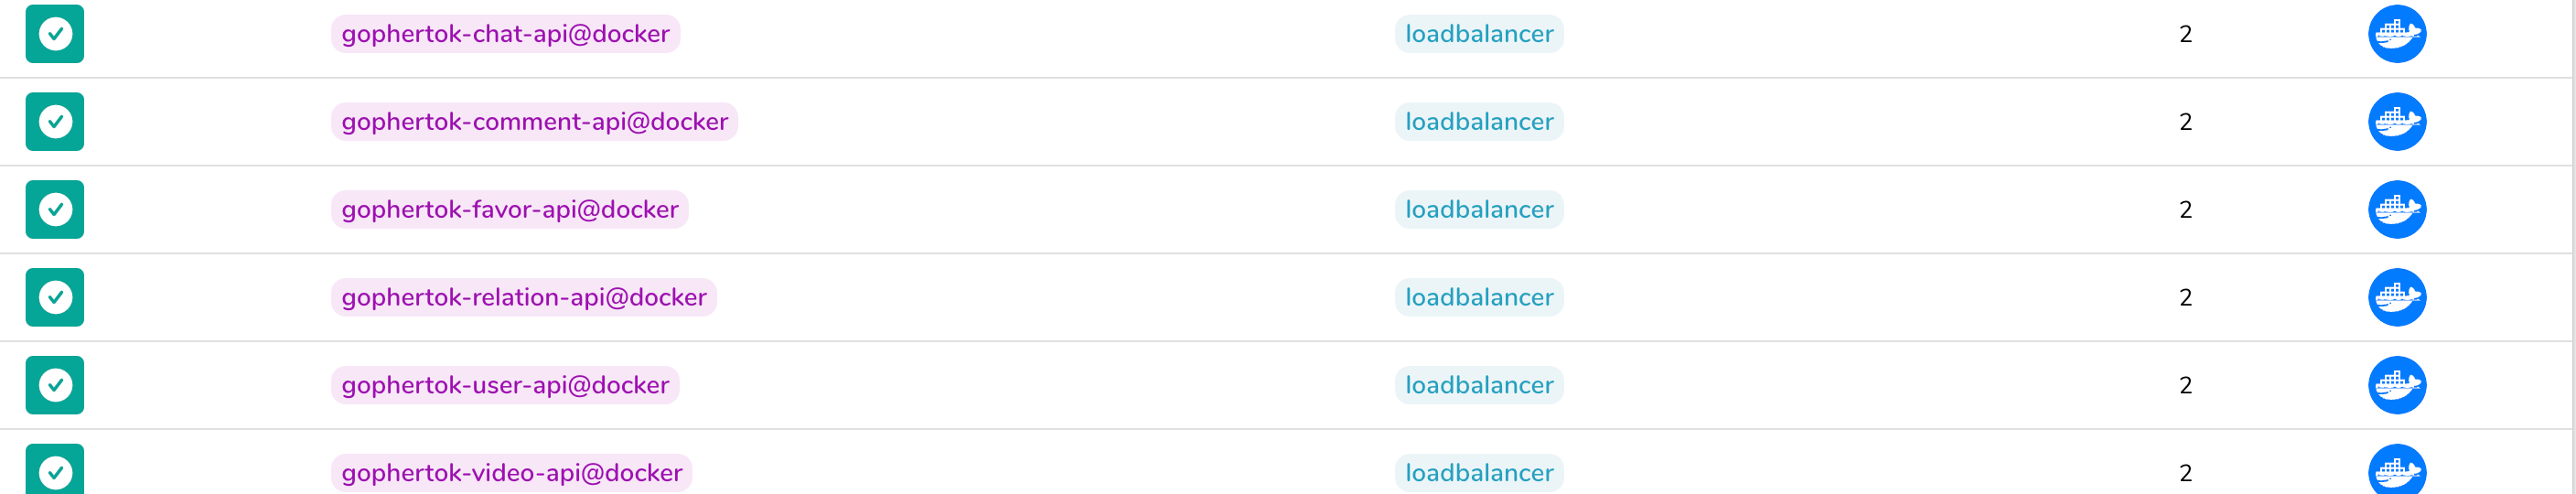
Traefik is used as the gateway, load balancing requests to the API containers of each service based on routing rules.
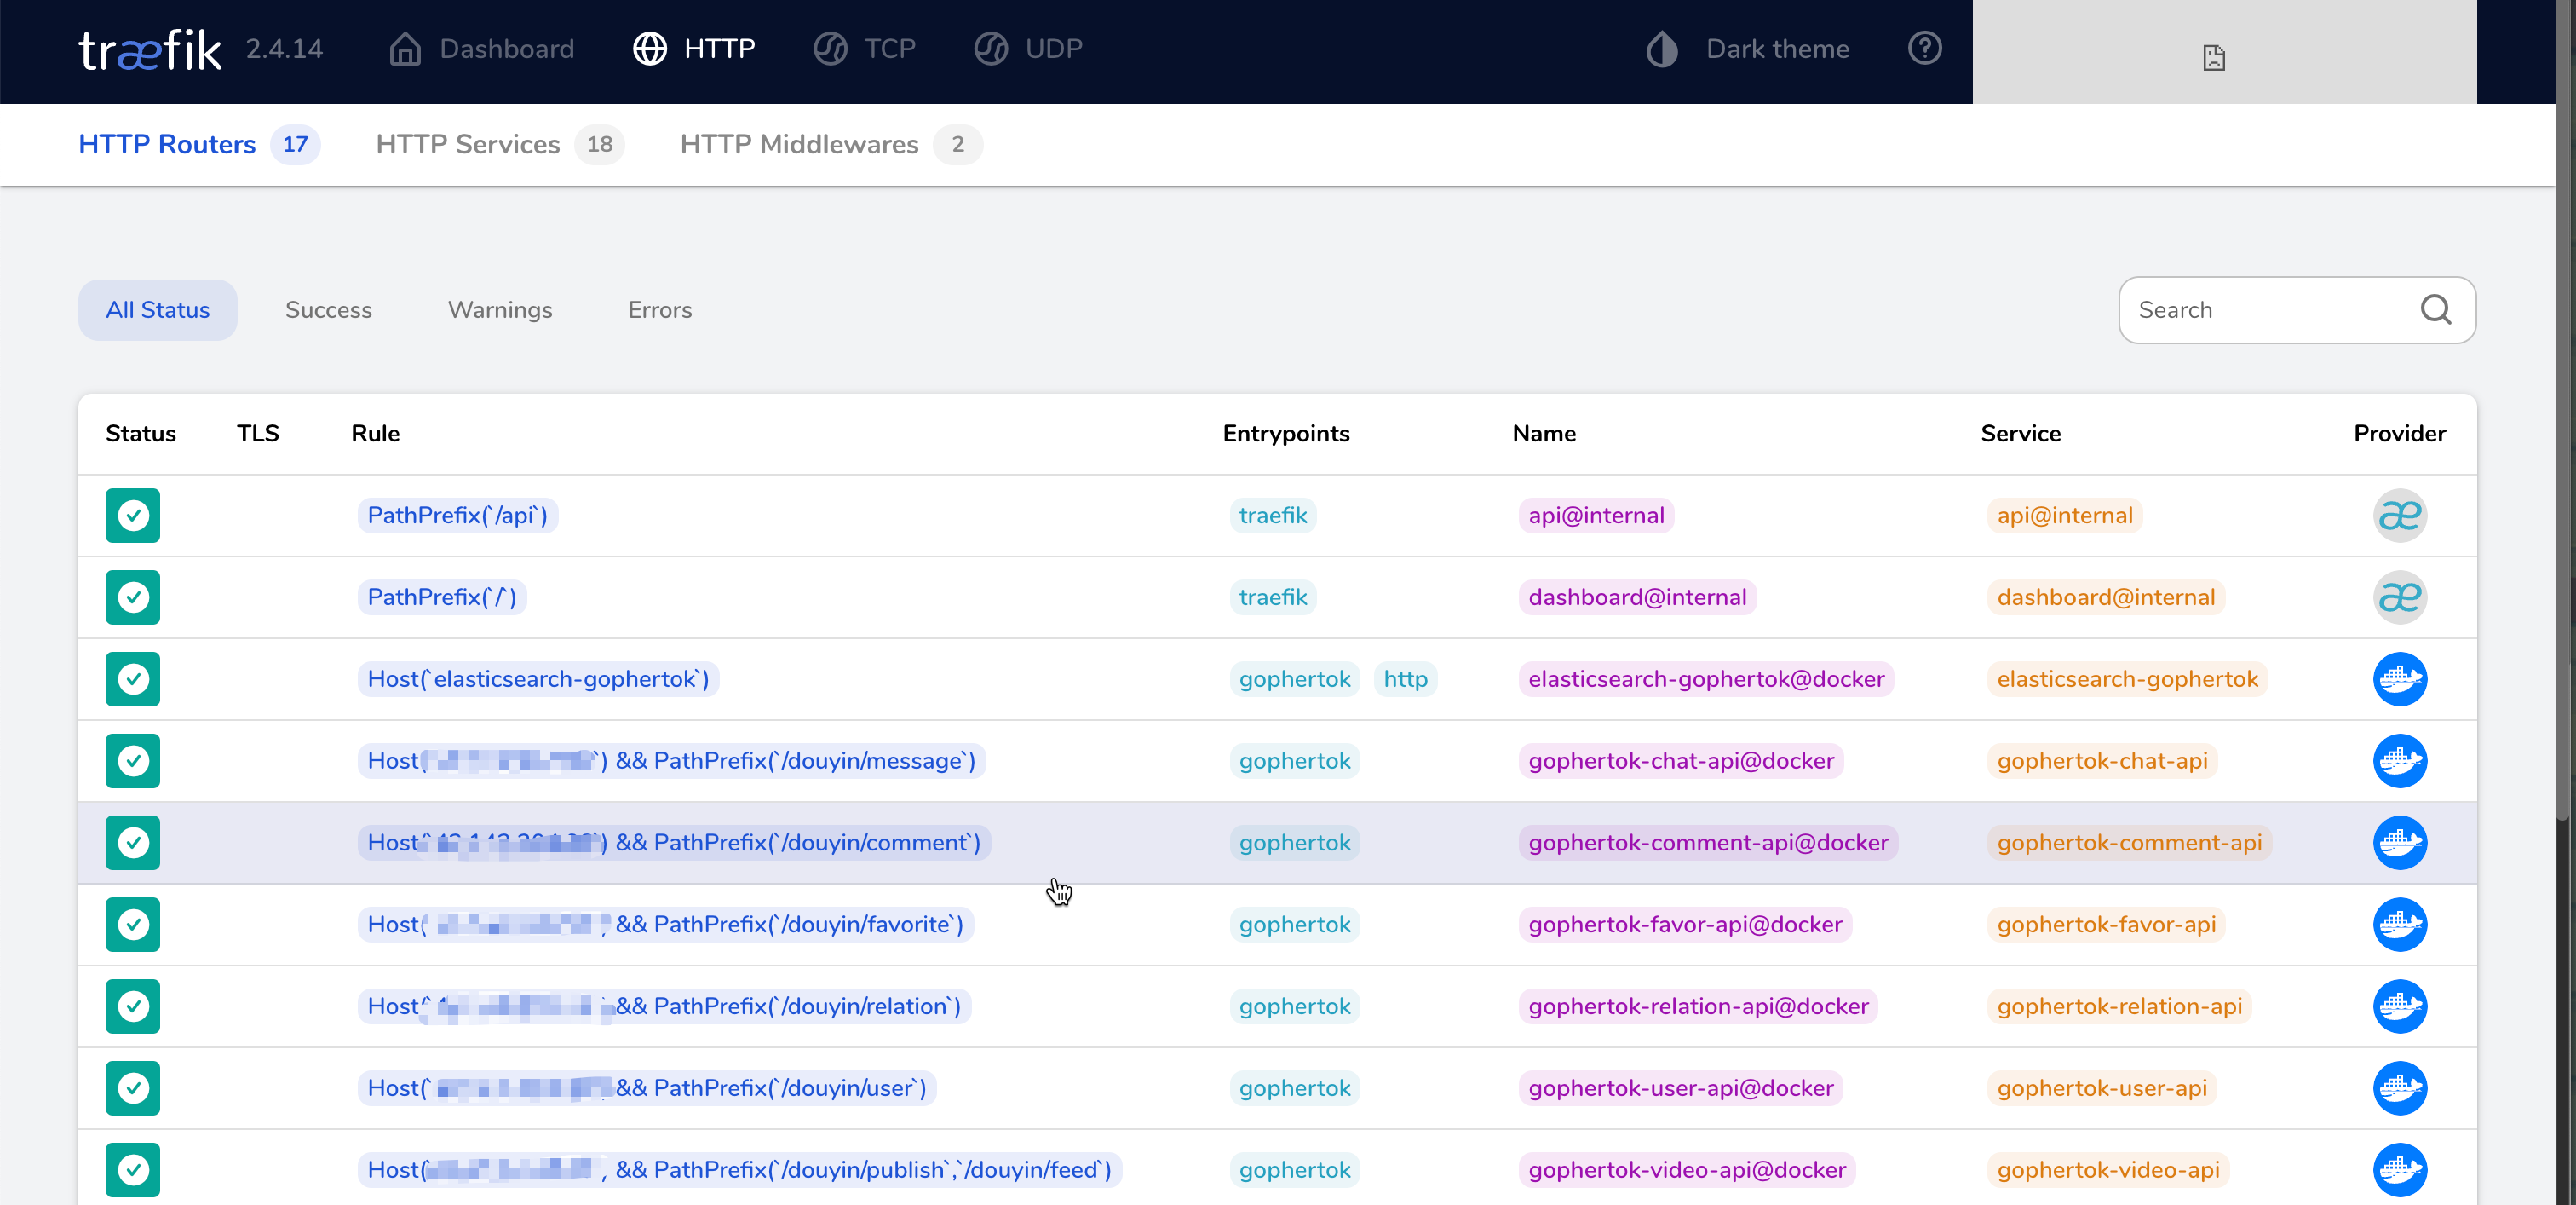
load-balanced to various service 'api' container instances
- Use
GitHub ActionforCI/CDand automate testing after each commit - Then you can manually build the image of each service, and automatically push it to the
dockerhubafter it is built - Then ssh into the remote server, using the new image and already written 'docker-compose' automatically deploy the new container
| Bytedance youth Camp |
|---|
 |
GopherTok is open-source under the MIT license. Please follow the MIT open source certificate rules under the premise of use