Contains the hvega module for creating
Vega-Lite visualizations
in Haskell, and the ihaskell-hvega module for viewing these
visualizations in
IHaskell notebooks,
although circa June 2021 the IHaskell integration is not as seamless
as I'd like.
This code is released under the BSD3 license.
See the hvega README for more details than given here.
Create Vega-Lite visualizations in Haskell. It targets version 4.15 of the Vega-Lite specification. Note that the module does not include a viewer for these visualizations (which are JSON files), but does provide several helper functions, such as toHtmlFile, which create HTML that can be viewed with a browser to display the visualization. Other approaches include automatic display in IHaskell notebooks - with the ihaskell-vega package - or use of external viewers such as Vega View and Vega-Desktop.
The hvega package started of as an almost-direct copy of version 2.2.1 of the
Elm Vega library,
which was released under a BSD3 license by Jo Wood of the giCentre at the
City University of London. The two have diverged somewhat since (mainly
that hvega still uses data types as its primary control structure
whilst the Elm version has moved to functions).
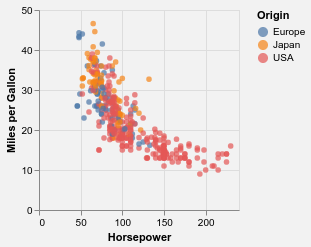
The Vega-Lite example gallery contain
a number of visualizations of the cars.json dataset, which has a number of
columns to display, such as "Horsepower", "Miles_per_Gallon", and "Origin". The
following code will create a visualization that plots the efficiency of the
cars (the "mpg") as a function of its Horsepower, and color-code by the
origin of the car:
let cars =  dataFromUrl "https://vega.github.io/vega-datasets/data/cars.json" []

    enc = encoding
            . position X [ PName "Horsepower", PmType Quantitative ]
            . position Y [ PName "Miles_per_Gallon", PmType Quantitative, PTitle "Miles per Gallon" ]
            . color [ MName "Origin" ]

    bkg = background "rgba(0, 0, 0, 0.05)"

in toVegaLite [ bkg, cars, mark Circle [MTooltip TTEncoding], enc [] ]
When the JSON is viewed with a Vega-Lite aware viewer, the resultant plot can be interacted with (e.g. to use the tooltip support) using the interactive version. It can also be viewed as a PNG:
See the ihaskell-hvega README for more details than given here.
View Vega-Lite visualizations
created by the hvega package in IHaskell notebooks.
When used with Jupyter notebooks it relies on Vega-Embed to do the hard work of parsing and displaying the Vega Lite specification.
If run in a Jupyter Lab then the native Vega support is used for
displaying the Vega Lite specifications. I recommend using
Tweag I/O's jupyterWith environment
to set this up, and have a rudimentary
shell.nix example
in the
notebooks directory.
The hvega package allows you to create a visualization but this is
just a JSON file - you still need a way to view it. There are a number
of ways:
- view it in the Vega Editor (although this is easiest for small JSON files)
- embed the file into a HTML page and use the Vega Embed Javascript library to view it
- the
hvegapackage contains helper routines that will create a HTML page that includesVega Embedfor viewing in a web browser (see toHtmlFile and related routines) - use a "Vega viewer" - I have a Haskell-based version at Vega View but there are alternatives, such as vega desktop.
The Vega-Lite ecosystem page contains a miriad useful links.
The packages are available on hackage:
There is a top-level stack.yaml which builds both hvega and
ihaskell-hvega using Stack.
There is also a default.nix file for development with
Nix - you can try
% nix-build
... wait an indeterminite time
% ./result/bin/ihaskell-notebook --notebook-dir notebooks
but it (currently) doesn't use the on-disk versions of hvega and
ihaskell-hvega. The notebooks/shell.nix file contains a version
that uses Tweag I/O's jupyterWith
environment environment but
that unfortunately seems to be using "old" versions of IHaskell and
ghc.
There is basic testing of the output of hvega, and the module also
contains a
tutorial
which contains plots you can view; e.g. with
Vega View or
Vega-Desktop.
The notebooks/
directory
contains a (very small, very random) sample of notebooks experimenting
with hvega. I recommend using Tweag I/O's jupyterWith
environment to view these
(although I have not been able to get this to work with the circa 2023
changes to jupyterwith). At present there is support for Jupyter notebook, whereas the support for Jupyter lab is unfortunately
limited (due to limitations on the current IHaskell environment and
differences between the Jupyter Lab versions).
There is also a Data Haskell example notebook, and the Monad-Bayes blog series by tweag.io which starts here.
I created this as a piece of procrastination, while procrastinating with a different task. At present I am not using it, due to lack of time. Please pop on over to GitHub, or ping me on Mastodon @[email protected] if you would like to help.


