Skip to content

A historical analysis of rainfall records in Australia over 10 years.

Notifications You must be signed in to change notification settings

Dion11235/Rainfall-Analysis-of-Australia

Folders and files

NameName
Last commit message
Last commit date

Latest commit


History

6 Commits


Repository files navigation

Rainfall-Analysis-of-Australia


Australia has always been a continent with diverse climate features beacause of its too diverse landscape. Here I have done detailed visualization and Exploratory study over climates of eight capital cities in Australia - 'Darwin','Sydney','Brisbane','Perth','Melbourne','Canberra','Hobart','Adelaide'. The whole analysis has been done in R-studio.

1. Cities on map based on rainfall


There are multiple desserts in the centre of Australia, like Gibson Desert, Tanami Desert, Simposon Desert. And the effect of this geography can be seen prominently from the plot above. We can clearly observe how the coastal cities have experienced more number of rainy days compared to the cities in the heart of australia.

2. How rainy are the capitals


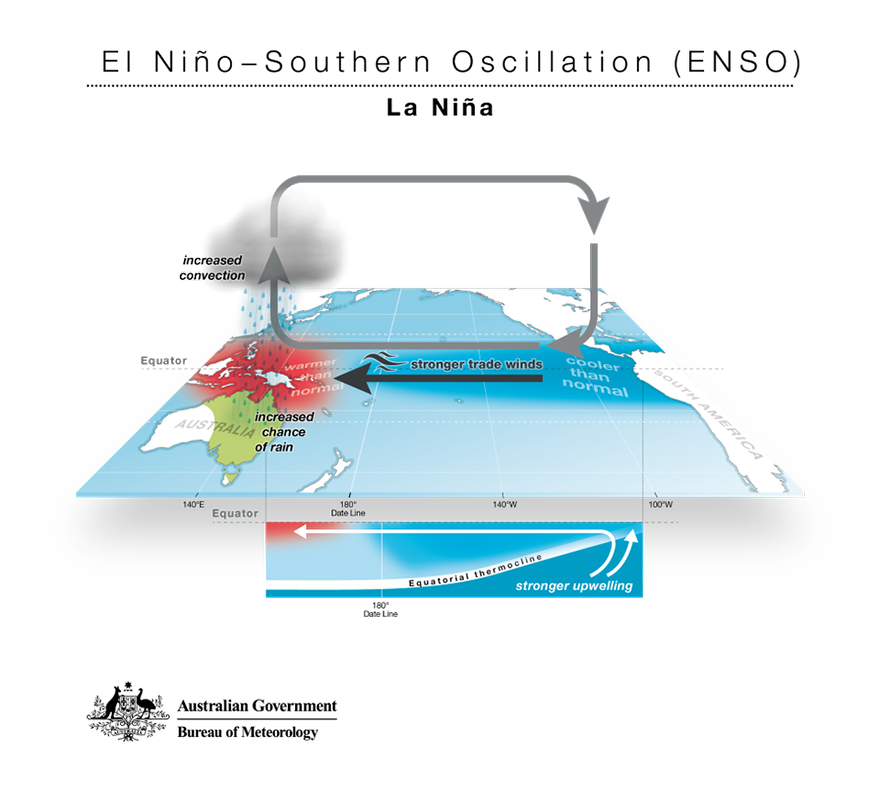
Now we shall focus only on the capitals mentioned in the beginning. Darwin gets on an average 1727.3 mm rainfall each year, where as Canberra gets 629 mm of rainfall on an average. The high rainfall in Darwin can be explained by the [El Nino-Southern Oscillation (ENSO)](https://en.wikipedia.org/wiki/El_Ni%C3%B1o#Australia_and_the_Southern_Pacific) in pacific ocean. ENSO is generally associated with a band of warm ocean water that develops in the central and east-central equatorial Pacific. Clearly Darwin being the northest city, gets affected the most during January mostly.

3. How stormy are the capitals


Here we can see the proportion of the stormy rainy days (i.e. number of rainy days with rainfall > 100 mm divided by total number of rainy days in that city) and the proportion of drizzling rainy days (< 50 mm). As El nino is mainly originated from the low pressure zone in the pacific ocean (located in the North-east direction of Australia) , The stormy thunderheads hit directly in the Northern and Eastern coastal cities of Australia. So we can see Darwin and Brisbane both have a very high proportion of stormy days over the past 10 years.


from now on we shall use the convention that the darker or lighter shade of any color denotes a city with higher number or lower number of rainy days respectively.

4. average humidity of capital cities


we can see the density of average humidity of the cities over past 10 years. The red dotted line denotes the mean. The right skewed curve of Darwin shows most days of Darwin have experienced humidity of 70%. an interesting thing to observe is that The density curve of Brisbane is tightly packed at near about 60% .

5. average temperature of capital cities


Astonishingly, Darwin has a very right skewed density curve for average temperature. So not only it experiences the most number of rainy days but also Darwin is quite hot, may be due to being the closest one to the Equador. The cities closer to the south pole (Adelaide, Hobart, Melbourne) should be much cold, and that is prominent from the lefft skewed curves.

6. average pressure of capital cities


Other than Perth most of the parts of Australia experiences a low pressure belt. As we can see from the plots.

7. monthly overview of rainfall over seasons


An immediate observation is that Darwin, Brisbane, Sydney all three have similar seasonal pattern over the months, and Mebourne, Adelaide, Perth all three have similar seasonal pattern and opposite to the first group of capitals. All the three cities in the first group are located in the east and north-east coastal side of Australia and the cities of the second group are located in the western coast of Australia. This opposite climate can be explained by two modes of El-Nino South Oscillation , namely El-Nion and La-Nina. Also there are other winds in effect.


to support the opposite wind directions in different seasons over the cities, in the next two plots we are seeing the wind directions in two cities - Darwin from North, Perth from South-West.

8. wind directions of Perth over seasons


9. Wind directions of Darwin over season


10. yearly overview of rainfall


one quick thing we can see is that Perth experienced rain for 12% of the whole year 2010. Perth experienced [the second driest year ever](http://www.bom.gov.au/climate/current/annual/wa/archive/2010.perth.shtml). But on the contrary, Darwin experienced [heavy monsoon burst in 2017](https://www.abc.net.au/news/2017-02-05/deluge-of-rain-causes-havoc-on-darwin-roads-and-minor-flooding/8242452) with 200 mm of rain for 24 hours continuously.


This was a complete visual climate analysis of Australia from 2007 to 2017. Thank you.

About

A historical analysis of rainfall records in Australia over 10 years.

Resources

Stars

Watchers

Forks

Releases

No releases published

Packages

No packages published

Languages