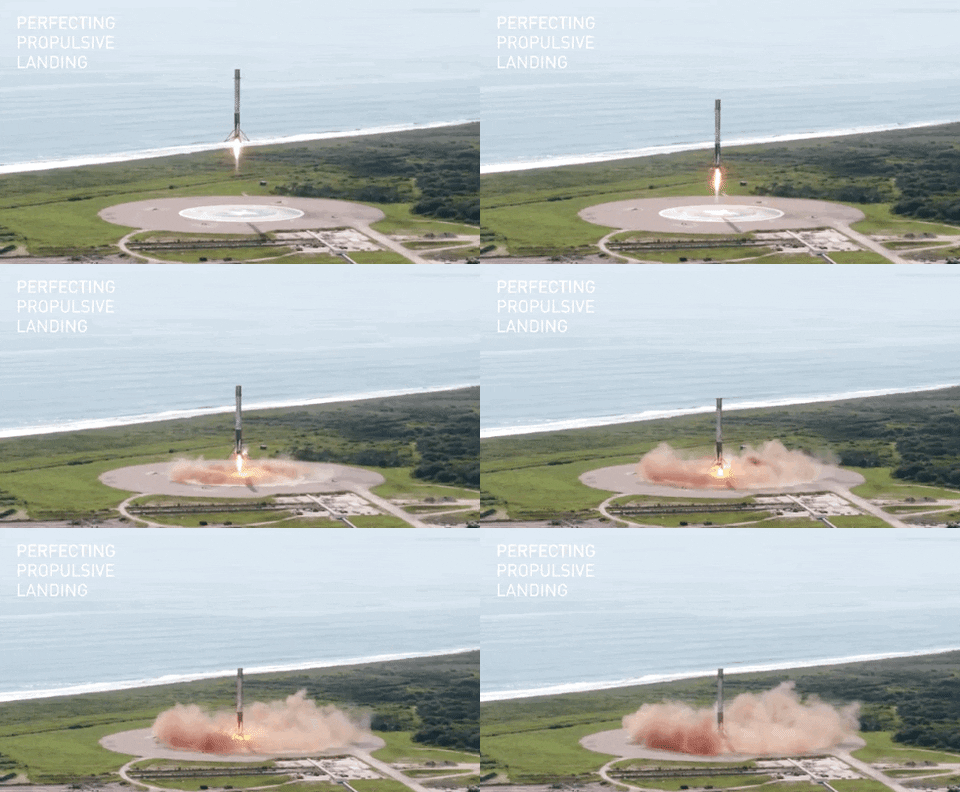
SpaceX, a leader in the space industry, strives to make space travel affordable for everyone. Its accomplishments include sending spacecraft to the international space station, launching a satellite constellation that provides internet access and sending manned missions to space. SpaceX can do this because the rocket launches are relatively inexpensive ($62 million per launch) due to its novel reuse of the first stage of its Falcon 9 rocket. Other providers, which are not able to reuse the first stage, cost upwards of $165 million each. By determining if the first stage will land, we can determine the price of the launch. To do this, we can use public data and machine learning models to predict whether SpaceX – or a competing company – can reuse the first stage.
- How payload mass, launch site, number of flights, and orbits affect first-stage landing success
- Rate of successful landings over time
- Best predictive model for successful landing (binary classification)
The research attempts to identify the factors for a successful rocket landing. To make this determination, the following methodologies where used:
- Collect data using SpaceX REST API and web scraping techniques
- Wrangle data to create success/fail outcome variable
- Explore data with data visualization techniques, considering the following factors: payload, launch site, flight number and yearly trend
- Analyze the data with SQL, calculating the following statistics: total payload, payload range for successful launches, and total # of successful and failed outcomes
- Explore launch site success rates and proximity to geographical markers
- Visualize the launch sites with the most success and successful payload ranges
- Build Models to predict landing outcomes using logistic regression, support vector machine (SVM), decision tree and K-nearest neighbor (KNN)
- Launch success has improved over time
- KSC LC-39A has the highest success rate among landing sites
- Orbits ES-L1, GEO, HEO, and SSO have a 100% success rate
- Most launch sites are near the equator, and all are close to the coast
- All models performed similarly on the test set. The decision tree model slightly outperformed when looking at .best_score_
- Request data from SpaceX API (rocket launch data)
- Decode response using .json() and convert to a dataframe using .json_normalize()
- Request information about the launches from SpaceX API using custom functions
- Create dictionary from the data
- Create dataframe from the dictionary
- Filter dataframe to contain only Falcon 9 launches
- Replace missing values of Payload Mass with calculated .mean()
- Export data to csv file
- Request data (Falcon 9 launch data) from Wikipedia
- Create BeautifulSoup object from HTML response
- Extract column names from HTML table header
- Collect data from parsing HTML tables
- Create dictionary from the data
- Create dataframe from the dictionary
- Export data to csv file
- Convert outcomes into 1 for a successful landing and 0 for an unsuccessful landing
- Create charts to analyze relationships and show comparisons
- Query the data to understand more about the data
- Create maps to visualize launch sites, view launch outcomes and see distance to proximities
- Create dashboard
- Pie chart showing successful launches
- Scatter chart showing Payload Mass vs. Success Rate by Booster Version
- Create NumPy array from the Class column
- Standardize the data with StandardScaler. Fit and transform the data.
- Split the data using train_test_split
- Create a GridSearchCV object with cv=10 for parameter optimization
- Apply GridSearchCV on different algorithms: logistic regression (LogisticRegression()), support vector machine (SVC()), decision tree (DecisionTreeClassifier()), K-Nearest Neighbor (KNeighborsClassifier())
- Calculate accuracy on the test data using .score() for all models
- Assess the confusion matrix for all models
- Identify the best model using Jaccard_Score, F1_Score and Accuracy
- Model Performance: The models performed similarly on the test set with the decision tree model slightly outperforming
- Equator: Most of the launch sites are near the equator for an additional natural boost - due to the rotational speed of earth - which helps save the cost of putting in extra fuel and boosters
- Coast: All the launch sites are close to the coast
- Launch Success: Increases over time
- KSC LC-39A: Has the highest success rate among launch sites. Has a 100% success rate for launches less than 5,500 kg
- Orbits: ES-L1, GEO, HEO, and SSO have a 100% success rate
- Payload Mass: Across all launch sites, the higher the payload mass (kg), the higher the success rate
- Dataset: A larger dataset will help build on the predictive analytics results to help understand if the findings can be generalizable to a larger data set
- Feature Analysis / PCA: Additional feature analysis or principal component analysis should be conducted to see if it can help improve accuracy
- XGBoost: Is a powerful model which was not utilized in this study. It would be interesting to see if it outperforms the other classification models
