-
Notifications
You must be signed in to change notification settings - Fork 99
Getting started
Go to either the Bandage website or the GitHub releases page to download prebuilt 64 bit executables for Mac, Windows or Linux. The Mac and Windows versions should come with all necessary libraries included and should work on OS X 10.7 or later and Windows 7 or later.
The Linux version is available in two flavours: dynamically-linked, which does not contain the GUI code, and statically-linked, which does. The dynamically-linked version is preferable, as it will use native GUI components, but it may be necessary to install the Qt5 package. The statically-linked version of Bandage has fewer dependencies but uses non-native GUI components.
It is also possible to build Bandage from source – the instructions are in the Bandage readme.
Many items in Bandage have a help icon next to them: . Click these to read a description of that part of Bandage.
Before you can do anything else in Bandage, you must load an assembly graph. Do this by choosing 'Load graph' from the 'File' menu.
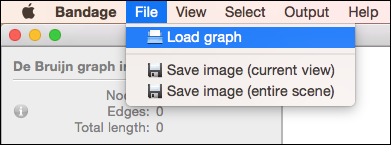
Small graphs should load quickly, though it may take some time for very large assembly graphs to load (see working with very large graphs).
After the graph is loaded, you can click the 'Draw graph' button to draw the graph to the screen. This step performs the graph layout, and the time it takes depends on the size of the graph and the graph layout settings (see graph layout and appearance).
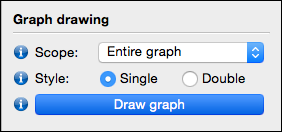
Note that on a Mac, the Command key (⌘) is used instead of the Ctrl key in the below instructions.
- Click on any node or edge to select it.
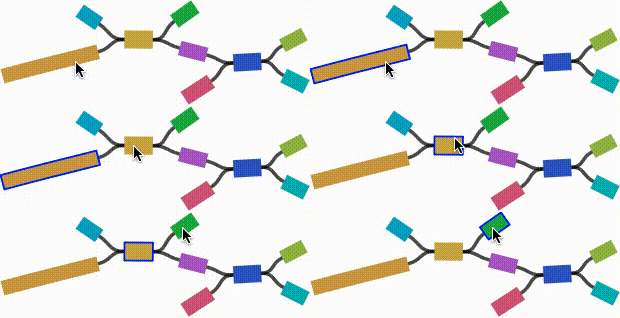
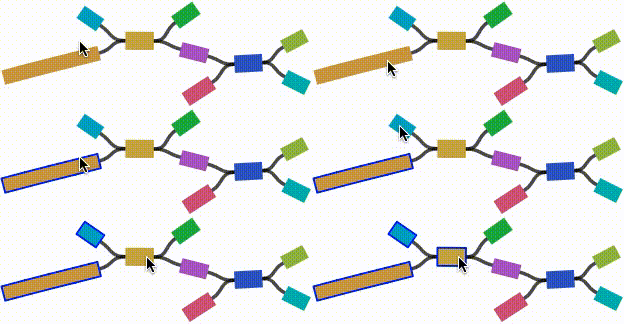
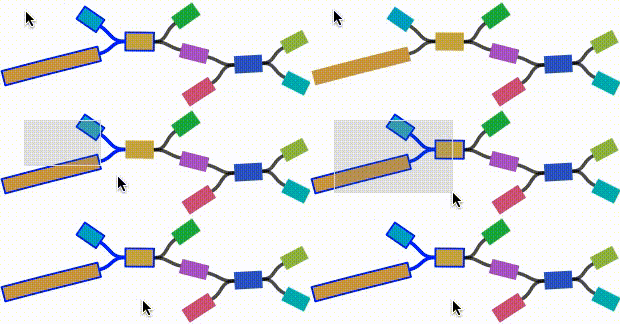
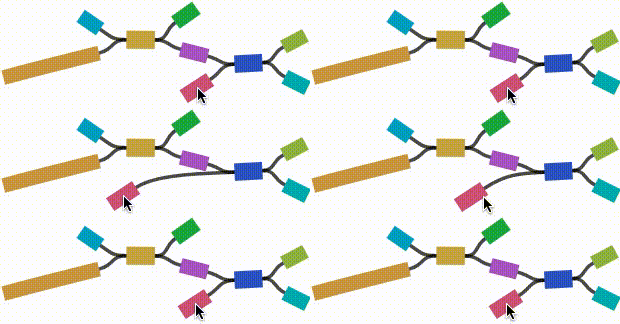
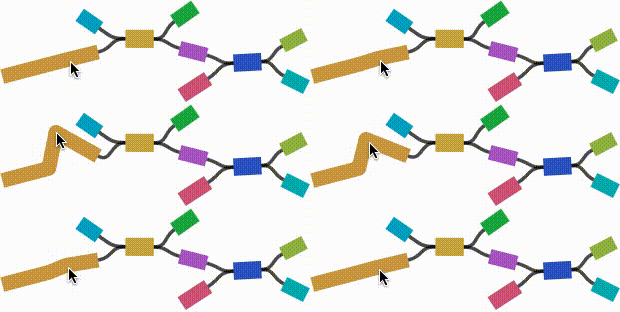
- Left click and drag on any node to move it. For short nodes, this will move the entire node. For long nodes, this will move the region of the node near the mouse cursor.

- Ctrl+mouse wheel to zoom the view in to and out from the location of your mouse cursor.
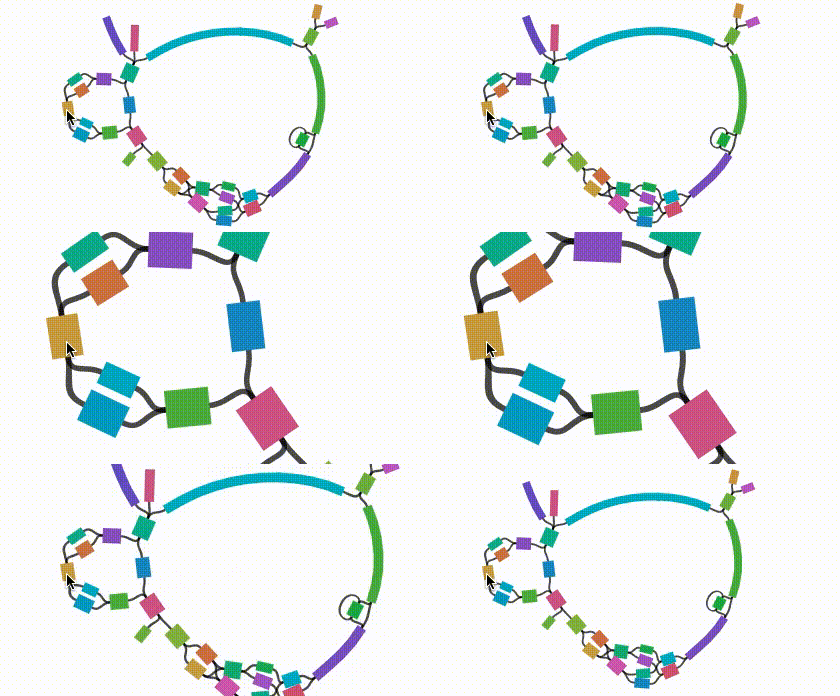
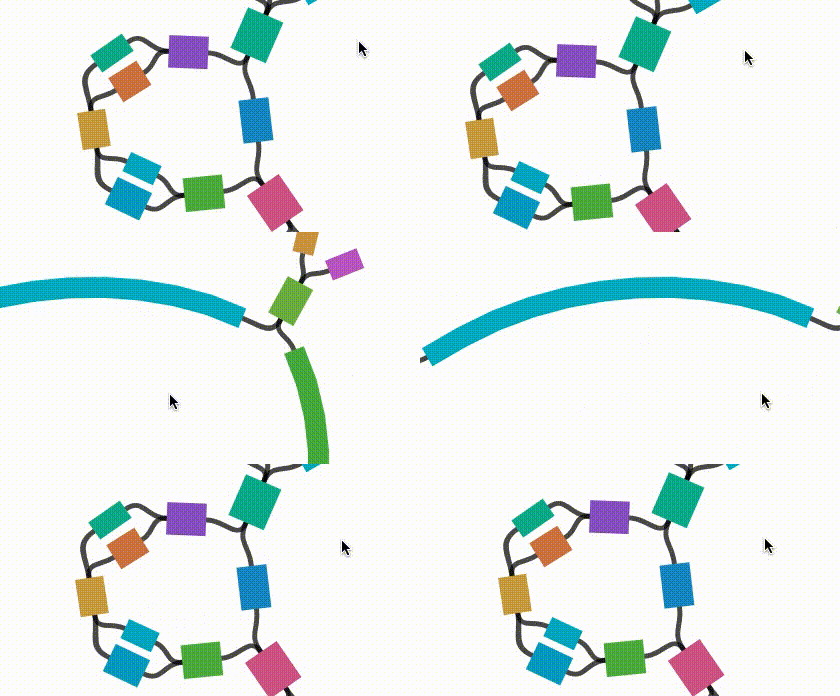
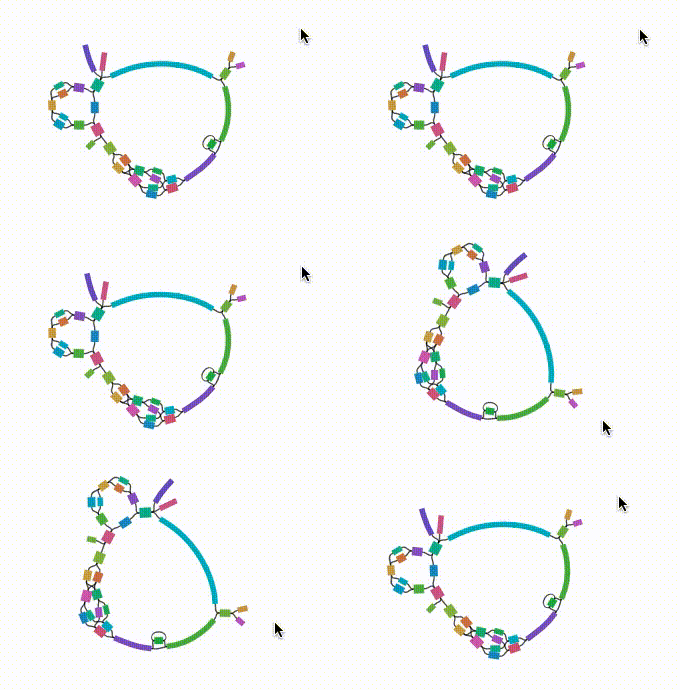
- It is first necessary to click in the viewport (or use tab until it is selected) so it will receive keyboard input.
- Use Ctrl+Plus and Ctrl+Minus to zoom in and out.
- Use arrow keys to pan the viewport horizontally and vertically.
- Use Ctrl+Shift+Plus and Ctrl+Shift+Minus to rotate the view clockwise and anti-clockwise.
- Home
- Getting started
- Settings:
- Functionality:
- Assembly:
- Example uses:
- Media:
- About