Reproducing separation #121
Comments
|
Hi @zalky Thanks for your interest in the paper and code! The code to reproduce figure 3B is in At a more fundamental level, the sample activation scores (for example, the ones given in Thanks! |
|
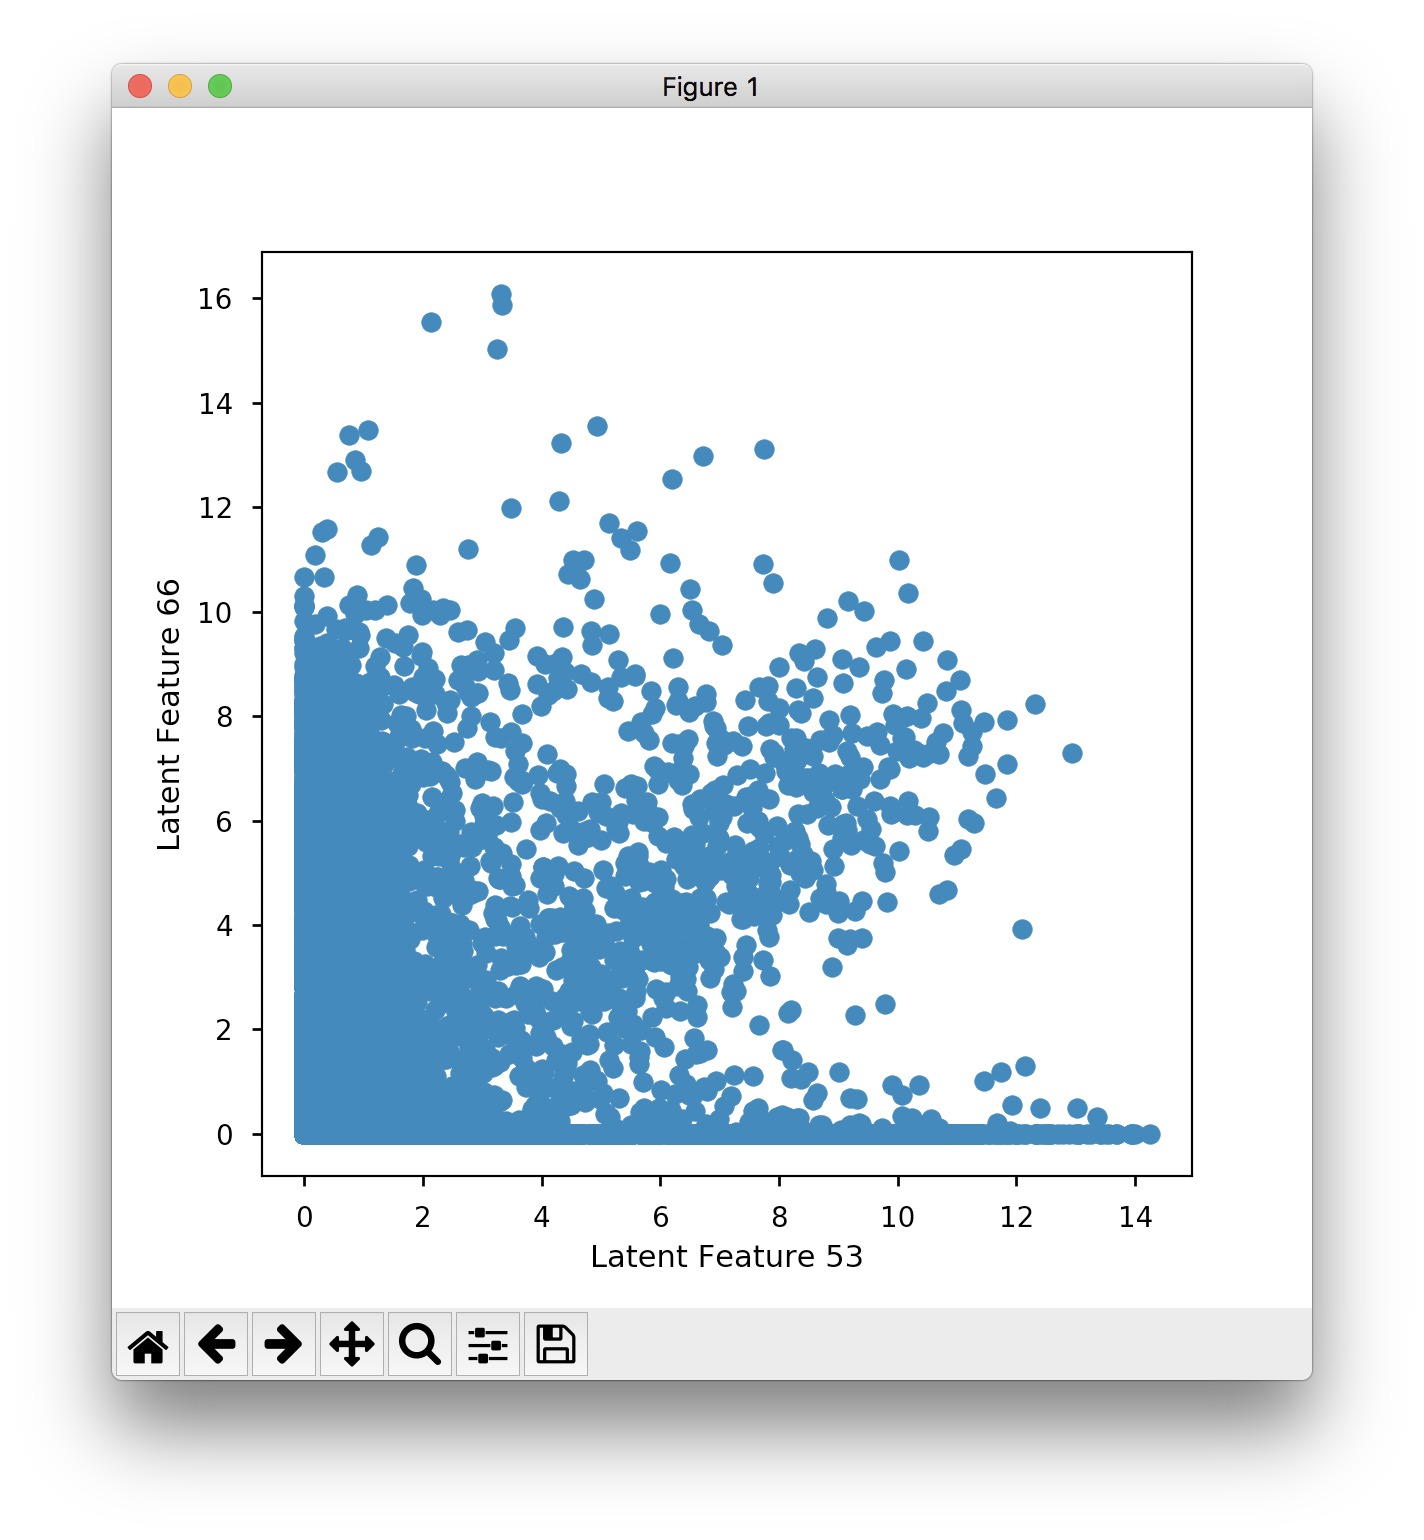
Hi Greg, thanks for the response! I agree that given the non-deterministic training model you would see some variation in results, but I was a bit surprised by the degree of difference. However, I think I have a lead on what is going on: I was loading the encoded data in encoded_df = pd.read_table(encoded_file, index_col=0)As is generally seen throughout the python code. Unfortunately I could not get this to reproduce the figures. However, if you load the encoded data without specifying the index column: encoded_rnaseq_df = pd.read_table(encoded_file)Then I can successfully reproduce Fig. 3B exactly (sans clinic colours) for encoding 53 and 66:
But by not specifying Going back, specifying I haven't pursued this issue any further than this, but is it possible that somewhere, maybe in the R code, something may be loading the sample labels in the first encoding column, thereby resulting in the encoding labels being off by one? |

|
Glad this was figured out - I agree that this issue is a potential pitfall in analyses (see #86)- I will bump this up in priority. Thanks again! |
Hi Greg,
Thanks for all the work in putting this together. I'm trying to reproduce some of the results, and can't quite seem to get the separation that is shown in the paper.
At the simplest, I'm loading the existing results saved in
encoded_rnaseq_onehidden_warmup_batchnorm.tsv, and then plotting:(assuming line 4 above should be
plt.ylabel) which produces:Which seems to have less separation than the sanity check in the IPython notebook. Similarly when I plot feature 53 against 66:
You can kind of see the cluster, but there is less separation than what is produced in Fig. 3B in the paper. When I train the model from scratch to produce the embeddings, I get similar separation to the saved results, and not the clear separation that you see in the papers.
Am I missing something?
The text was updated successfully, but these errors were encountered: