[Feature] Add plots for regression #148
Description
Is your feature request related to a problem? Please describe.
Not related to a problem.
Describe the solution you'd like
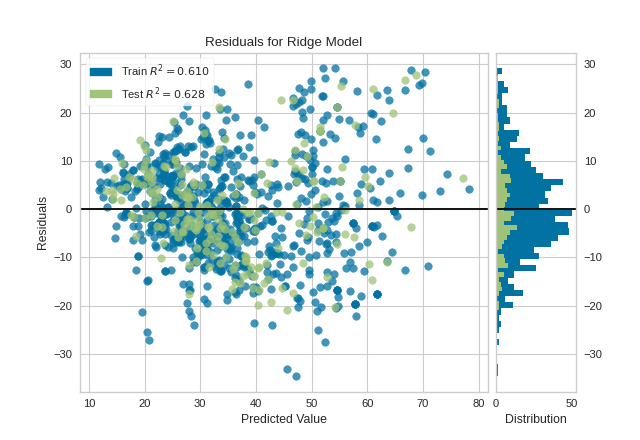
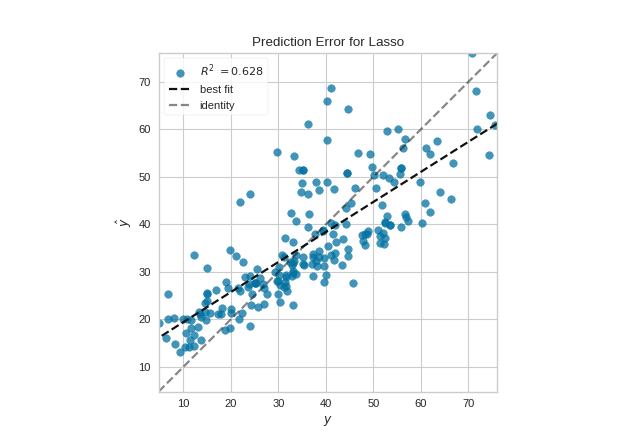
I'd like to have plots for regression such as:
residual plot(y_predicted, residuals)prediction error(y_true, y_predicted)
Describe alternatives you've considered
I have been using yellowbrick for when I train scikit-learn models:
I'd like to have similar interpretation when using SageMaker Studio/Pipelines.
Additional context